Yup'ik vs Immigrants from Sweden Householder Income Ages 45 - 64 years
COMPARE
Yup'ik
Immigrants from Sweden
Householder Income Ages 45 - 64 years
Householder Income Ages 45 - 64 years Comparison
Yup'ik
Immigrants from Sweden
$81,000
HOUSEHOLDER INCOME AGES 45 - 64 YEARS
0.0/ 100
METRIC RATING
324th/ 347
METRIC RANK
$118,318
HOUSEHOLDER INCOME AGES 45 - 64 YEARS
100.0/ 100
METRIC RATING
26th/ 347
METRIC RANK
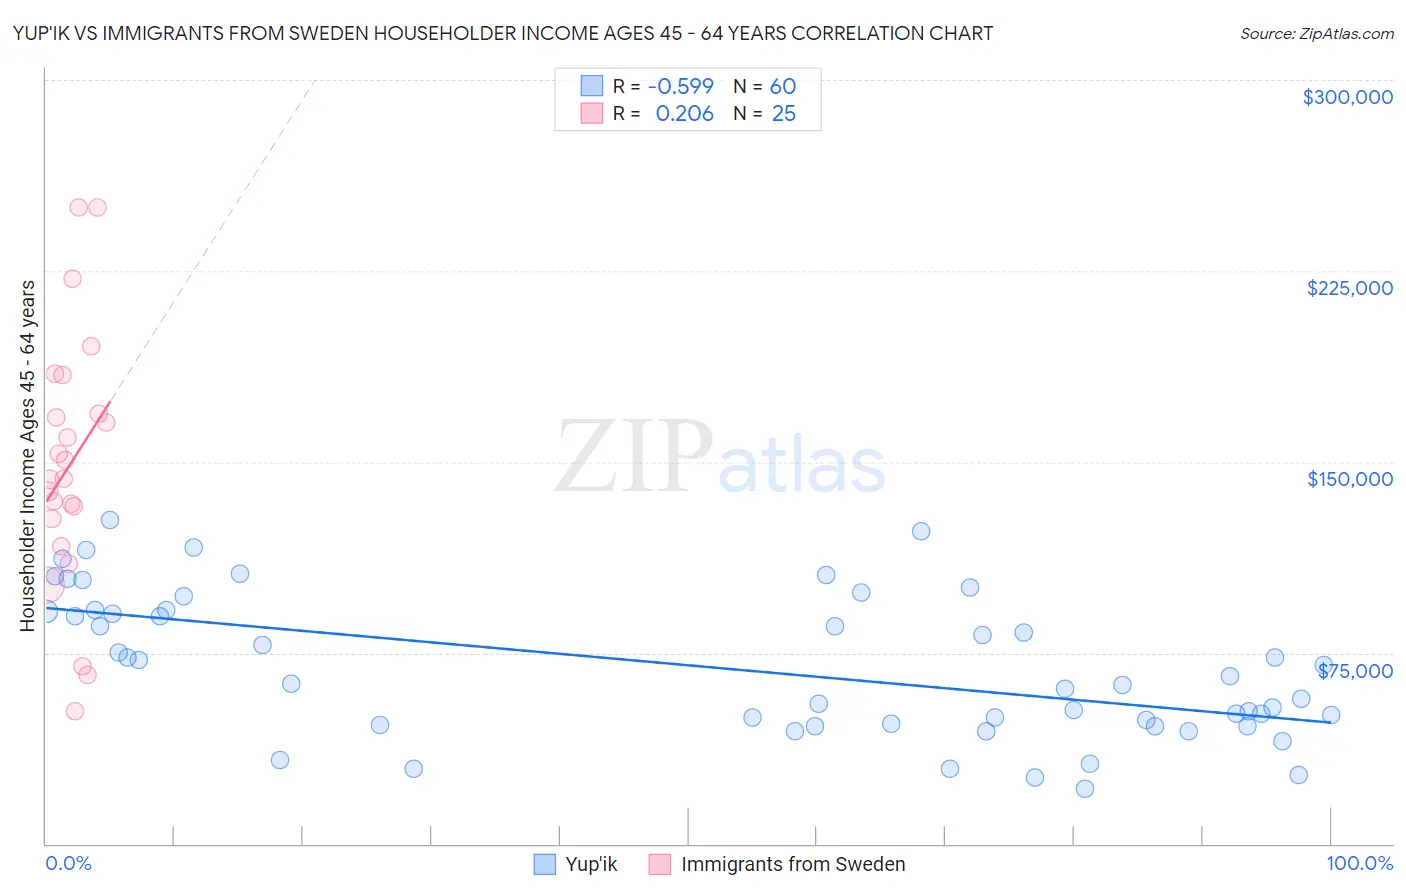
Yup'ik vs Immigrants from Sweden Householder Income Ages 45 - 64 years Correlation Chart
The statistical analysis conducted on geographies consisting of 39,943,055 people shows a substantial negative correlation between the proportion of Yup'ik and household income with householder between the ages 45 and 64 in the United States with a correlation coefficient (R) of -0.599 and weighted average of $81,000. Similarly, the statistical analysis conducted on geographies consisting of 164,674,181 people shows a weak positive correlation between the proportion of Immigrants from Sweden and household income with householder between the ages 45 and 64 in the United States with a correlation coefficient (R) of 0.206 and weighted average of $118,318, a difference of 46.1%.
Householder Income Ages 45 - 64 years Correlation Summary
| Measurement | Yup'ik | Immigrants from Sweden |
| Minimum | $21,563 | $52,031 |
| Maximum | $127,108 | $250,001 |
| Range | $105,545 | $197,970 |
| Mean | $69,372 | $148,842 |
| Median | $64,271 | $143,294 |
| Interquartile 25% (IQ1) | $46,840 | $122,314 |
| Interquartile 75% (IQ3) | $91,495 | $176,365 |
| Interquartile Range (IQR) | $44,656 | $54,051 |
| Standard Deviation (Sample) | $27,859 | $50,116 |
| Standard Deviation (Population) | $27,626 | $49,103 |
Similar Demographics by Householder Income Ages 45 - 64 years
Demographics Similar to Yup'ik by Householder Income Ages 45 - 64 years
In terms of householder income ages 45 - 64 years, the demographic groups most similar to Yup'ik are Immigrants from Cuba ($80,662, a difference of 0.42%), Bahamian ($81,369, a difference of 0.46%), Dominican ($80,623, a difference of 0.47%), Sioux ($81,750, a difference of 0.93%), and Seminole ($80,077, a difference of 1.1%).
| Demographics | Rating | Rank | Householder Income Ages 45 - 64 years |
| Colville | 0.0 /100 | #317 | Tragic $82,474 |
| Choctaw | 0.0 /100 | #318 | Tragic $82,287 |
| Chickasaw | 0.0 /100 | #319 | Tragic $82,193 |
| Apache | 0.0 /100 | #320 | Tragic $82,184 |
| Yuman | 0.0 /100 | #321 | Tragic $82,139 |
| Sioux | 0.0 /100 | #322 | Tragic $81,750 |
| Bahamians | 0.0 /100 | #323 | Tragic $81,369 |
| Yup'ik | 0.0 /100 | #324 | Tragic $81,000 |
| Immigrants | Cuba | 0.0 /100 | #325 | Tragic $80,662 |
| Dominicans | 0.0 /100 | #326 | Tragic $80,623 |
| Seminole | 0.0 /100 | #327 | Tragic $80,077 |
| Natives/Alaskans | 0.0 /100 | #328 | Tragic $79,816 |
| Dutch West Indians | 0.0 /100 | #329 | Tragic $79,171 |
| Creek | 0.0 /100 | #330 | Tragic $78,960 |
| Immigrants | Dominican Republic | 0.0 /100 | #331 | Tragic $78,836 |
Demographics Similar to Immigrants from Sweden by Householder Income Ages 45 - 64 years
In terms of householder income ages 45 - 64 years, the demographic groups most similar to Immigrants from Sweden are Asian ($118,426, a difference of 0.090%), Immigrants from Japan ($118,498, a difference of 0.15%), Immigrants from Northern Europe ($117,930, a difference of 0.33%), Turkish ($117,814, a difference of 0.43%), and Bolivian ($118,871, a difference of 0.47%).
| Demographics | Rating | Rank | Householder Income Ages 45 - 64 years |
| Eastern Europeans | 100.0 /100 | #19 | Exceptional $120,684 |
| Immigrants | Australia | 100.0 /100 | #20 | Exceptional $119,308 |
| Immigrants | Sri Lanka | 100.0 /100 | #21 | Exceptional $119,094 |
| Immigrants | Belgium | 100.0 /100 | #22 | Exceptional $118,932 |
| Bolivians | 100.0 /100 | #23 | Exceptional $118,871 |
| Immigrants | Japan | 100.0 /100 | #24 | Exceptional $118,498 |
| Asians | 100.0 /100 | #25 | Exceptional $118,426 |
| Immigrants | Sweden | 100.0 /100 | #26 | Exceptional $118,318 |
| Immigrants | Northern Europe | 100.0 /100 | #27 | Exceptional $117,930 |
| Turks | 100.0 /100 | #28 | Exceptional $117,814 |
| Bhutanese | 100.0 /100 | #29 | Exceptional $117,750 |
| Immigrants | Bolivia | 100.0 /100 | #30 | Exceptional $117,731 |
| Immigrants | Asia | 100.0 /100 | #31 | Exceptional $116,566 |
| Russians | 100.0 /100 | #32 | Exceptional $116,328 |
| Chinese | 100.0 /100 | #33 | Exceptional $116,156 |