Immigrants from Lebanon vs Immigrants from Chile Householder Income Ages 45 - 64 years
COMPARE
Immigrants from Lebanon
Immigrants from Chile
Householder Income Ages 45 - 64 years
Householder Income Ages 45 - 64 years Comparison
Immigrants from Lebanon
Immigrants from Chile
$108,471
HOUSEHOLDER INCOME AGES 45 - 64 YEARS
98.3/ 100
METRIC RATING
91st/ 347
METRIC RANK
$103,412
HOUSEHOLDER INCOME AGES 45 - 64 YEARS
82.5/ 100
METRIC RATING
146th/ 347
METRIC RANK
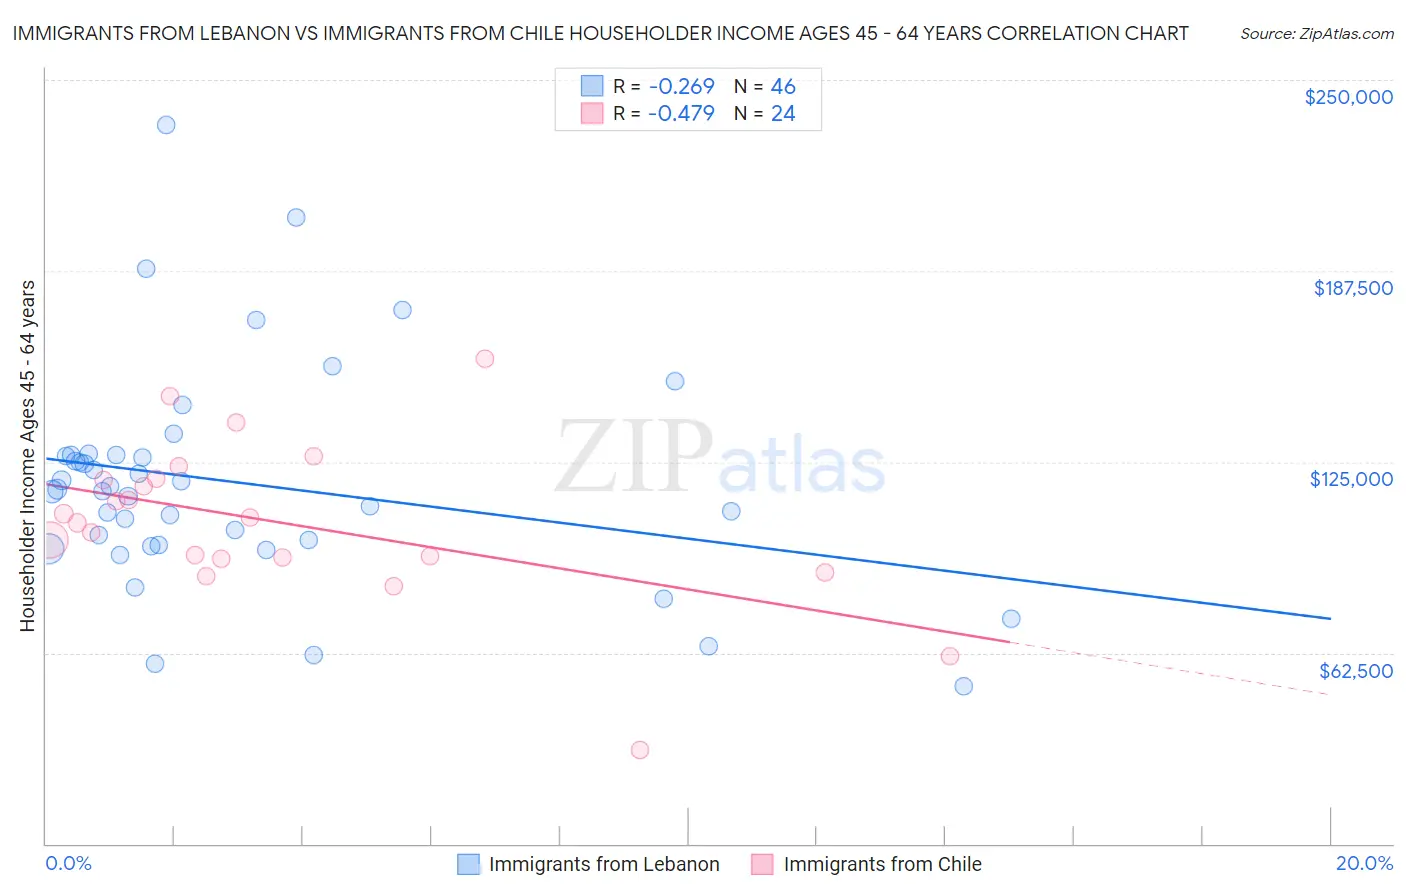
Immigrants from Lebanon vs Immigrants from Chile Householder Income Ages 45 - 64 years Correlation Chart
The statistical analysis conducted on geographies consisting of 217,063,471 people shows a weak negative correlation between the proportion of Immigrants from Lebanon and household income with householder between the ages 45 and 64 in the United States with a correlation coefficient (R) of -0.269 and weighted average of $108,471. Similarly, the statistical analysis conducted on geographies consisting of 218,523,915 people shows a moderate negative correlation between the proportion of Immigrants from Chile and household income with householder between the ages 45 and 64 in the United States with a correlation coefficient (R) of -0.479 and weighted average of $103,412, a difference of 4.9%.
Householder Income Ages 45 - 64 years Correlation Summary
| Measurement | Immigrants from Lebanon | Immigrants from Chile |
| Minimum | $51,559 | $30,865 |
| Maximum | $235,112 | $158,750 |
| Range | $183,553 | $127,885 |
| Mean | $118,072 | $105,152 |
| Median | $115,795 | $105,926 |
| Interquartile 25% (IQ1) | $97,661 | $93,461 |
| Interquartile 75% (IQ3) | $127,190 | $119,302 |
| Interquartile Range (IQR) | $29,528 | $25,840 |
| Standard Deviation (Sample) | $36,074 | $26,462 |
| Standard Deviation (Population) | $35,680 | $25,904 |
Similar Demographics by Householder Income Ages 45 - 64 years
Demographics Similar to Immigrants from Lebanon by Householder Income Ages 45 - 64 years
In terms of householder income ages 45 - 64 years, the demographic groups most similar to Immigrants from Lebanon are Ukrainian ($108,475, a difference of 0.0%), Immigrants from Philippines ($108,471, a difference of 0.0%), Croatian ($108,383, a difference of 0.080%), Romanian ($108,609, a difference of 0.13%), and Immigrants from Croatia ($108,304, a difference of 0.15%).
| Demographics | Rating | Rank | Householder Income Ages 45 - 64 years |
| Immigrants | Western Europe | 98.6 /100 | #84 | Exceptional $108,824 |
| Immigrants | Afghanistan | 98.6 /100 | #85 | Exceptional $108,785 |
| Austrians | 98.5 /100 | #86 | Exceptional $108,692 |
| Tongans | 98.5 /100 | #87 | Exceptional $108,643 |
| Romanians | 98.5 /100 | #88 | Exceptional $108,609 |
| Ukrainians | 98.3 /100 | #89 | Exceptional $108,475 |
| Immigrants | Philippines | 98.3 /100 | #90 | Exceptional $108,471 |
| Immigrants | Lebanon | 98.3 /100 | #91 | Exceptional $108,471 |
| Croatians | 98.3 /100 | #92 | Exceptional $108,383 |
| Immigrants | Croatia | 98.2 /100 | #93 | Exceptional $108,304 |
| Sri Lankans | 98.2 /100 | #94 | Exceptional $108,270 |
| Immigrants | Hungary | 98.2 /100 | #95 | Exceptional $108,267 |
| Immigrants | Argentina | 98.2 /100 | #96 | Exceptional $108,264 |
| Northern Europeans | 97.8 /100 | #97 | Exceptional $107,870 |
| Immigrants | Southern Europe | 97.7 /100 | #98 | Exceptional $107,775 |
Demographics Similar to Immigrants from Chile by Householder Income Ages 45 - 64 years
In terms of householder income ages 45 - 64 years, the demographic groups most similar to Immigrants from Chile are Basque ($103,387, a difference of 0.020%), Ugandan ($103,472, a difference of 0.060%), Czech ($103,507, a difference of 0.090%), Serbian ($103,522, a difference of 0.11%), and Luxembourger ($103,536, a difference of 0.12%).
| Demographics | Rating | Rank | Householder Income Ages 45 - 64 years |
| Immigrants | Oceania | 84.5 /100 | #139 | Excellent $103,705 |
| Norwegians | 84.3 /100 | #140 | Excellent $103,682 |
| Immigrants | Uganda | 83.7 /100 | #141 | Excellent $103,584 |
| Luxembourgers | 83.3 /100 | #142 | Excellent $103,536 |
| Serbians | 83.2 /100 | #143 | Excellent $103,522 |
| Czechs | 83.1 /100 | #144 | Excellent $103,507 |
| Ugandans | 82.9 /100 | #145 | Excellent $103,472 |
| Immigrants | Chile | 82.5 /100 | #146 | Excellent $103,412 |
| Basques | 82.3 /100 | #147 | Excellent $103,387 |
| Immigrants | Germany | 81.5 /100 | #148 | Excellent $103,282 |
| Immigrants | Sierra Leone | 81.1 /100 | #149 | Excellent $103,227 |
| Immigrants | Peru | 80.7 /100 | #150 | Excellent $103,173 |
| Swiss | 79.9 /100 | #151 | Good $103,071 |
| Irish | 79.8 /100 | #152 | Good $103,067 |
| Scandinavians | 79.0 /100 | #153 | Good $102,969 |