Yup'ik vs Ottawa Householder Income Ages 45 - 64 years
COMPARE
Yup'ik
Ottawa
Householder Income Ages 45 - 64 years
Householder Income Ages 45 - 64 years Comparison
Yup'ik
Ottawa
$81,000
HOUSEHOLDER INCOME AGES 45 - 64 YEARS
0.0/ 100
METRIC RATING
324th/ 347
METRIC RANK
$83,953
HOUSEHOLDER INCOME AGES 45 - 64 YEARS
0.0/ 100
METRIC RATING
304th/ 347
METRIC RANK
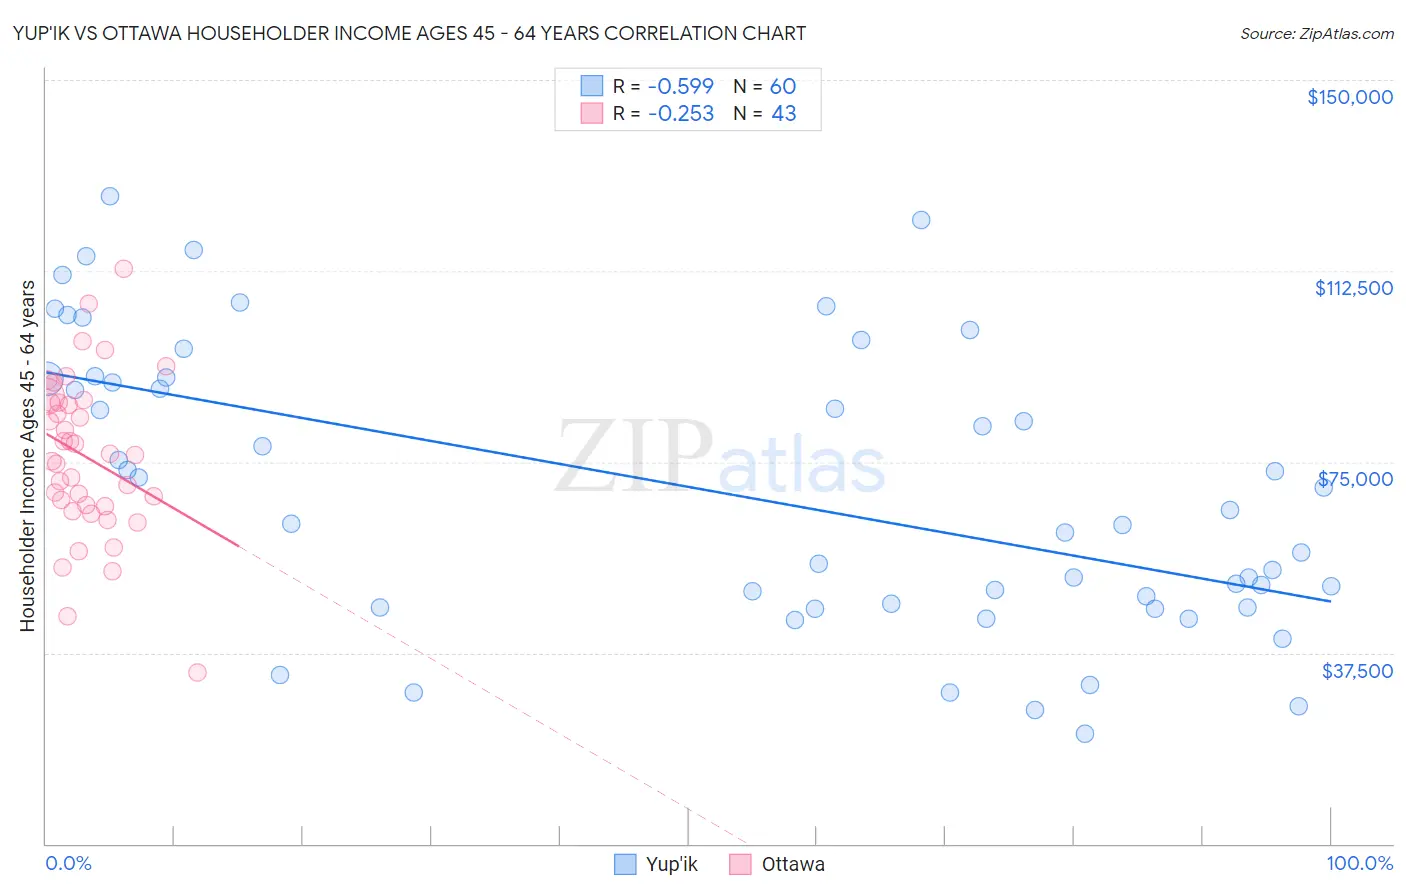
Yup'ik vs Ottawa Householder Income Ages 45 - 64 years Correlation Chart
The statistical analysis conducted on geographies consisting of 39,943,055 people shows a substantial negative correlation between the proportion of Yup'ik and household income with householder between the ages 45 and 64 in the United States with a correlation coefficient (R) of -0.599 and weighted average of $81,000. Similarly, the statistical analysis conducted on geographies consisting of 49,895,543 people shows a weak negative correlation between the proportion of Ottawa and household income with householder between the ages 45 and 64 in the United States with a correlation coefficient (R) of -0.253 and weighted average of $83,953, a difference of 3.6%.
Householder Income Ages 45 - 64 years Correlation Summary
| Measurement | Yup'ik | Ottawa |
| Minimum | $21,563 | $33,750 |
| Maximum | $127,108 | $112,917 |
| Range | $105,545 | $79,167 |
| Mean | $69,372 | $75,969 |
| Median | $64,271 | $76,250 |
| Interquartile 25% (IQ1) | $46,840 | $66,250 |
| Interquartile 75% (IQ3) | $91,495 | $86,776 |
| Interquartile Range (IQR) | $44,656 | $20,526 |
| Standard Deviation (Sample) | $27,859 | $15,805 |
| Standard Deviation (Population) | $27,626 | $15,620 |
Demographics Similar to Yup'ik and Ottawa by Householder Income Ages 45 - 64 years
In terms of householder income ages 45 - 64 years, the demographic groups most similar to Yup'ik are Bahamian ($81,369, a difference of 0.46%), Sioux ($81,750, a difference of 0.93%), Yuman ($82,139, a difference of 1.4%), Apache ($82,184, a difference of 1.5%), and Chickasaw ($82,193, a difference of 1.5%). Similarly, the demographic groups most similar to Ottawa are Chippewa ($83,943, a difference of 0.010%), Ute ($83,937, a difference of 0.020%), Shoshone ($83,588, a difference of 0.44%), Immigrants from Cabo Verde ($83,542, a difference of 0.49%), and Immigrants from Dominica ($83,311, a difference of 0.77%).
| Demographics | Rating | Rank | Householder Income Ages 45 - 64 years |
| Ottawa | 0.0 /100 | #304 | Tragic $83,953 |
| Chippewa | 0.0 /100 | #305 | Tragic $83,943 |
| Ute | 0.0 /100 | #306 | Tragic $83,937 |
| Shoshone | 0.0 /100 | #307 | Tragic $83,588 |
| Immigrants | Cabo Verde | 0.0 /100 | #308 | Tragic $83,542 |
| Immigrants | Dominica | 0.0 /100 | #309 | Tragic $83,311 |
| Immigrants | Haiti | 0.0 /100 | #310 | Tragic $83,257 |
| Immigrants | Bahamas | 0.0 /100 | #311 | Tragic $83,177 |
| Cajuns | 0.0 /100 | #312 | Tragic $83,015 |
| U.S. Virgin Islanders | 0.0 /100 | #313 | Tragic $82,736 |
| Immigrants | Honduras | 0.0 /100 | #314 | Tragic $82,697 |
| Paiute | 0.0 /100 | #315 | Tragic $82,629 |
| Immigrants | Caribbean | 0.0 /100 | #316 | Tragic $82,513 |
| Colville | 0.0 /100 | #317 | Tragic $82,474 |
| Choctaw | 0.0 /100 | #318 | Tragic $82,287 |
| Chickasaw | 0.0 /100 | #319 | Tragic $82,193 |
| Apache | 0.0 /100 | #320 | Tragic $82,184 |
| Yuman | 0.0 /100 | #321 | Tragic $82,139 |
| Sioux | 0.0 /100 | #322 | Tragic $81,750 |
| Bahamians | 0.0 /100 | #323 | Tragic $81,369 |
| Yup'ik | 0.0 /100 | #324 | Tragic $81,000 |