European vs Immigrants from Chile Householder Income Ages 45 - 64 years

COMPARE

European
Race
Ancestry
AfghanAfricanAlaska NativeAlaskan AthabascanAlbanianAleutAlsatianAmericanApacheArabArapahoArgentineanArmenianAssyrian/Chaldean/SyriacAustralianAustrianBahamianBangladeshiBarbadianBasqueBelgianBelizeanBermudanBhutaneseBlackfeetBolivianBrazilianBritishBritish West IndianBulgarianBurmeseCajunCambodianCanadianCape VerdeanCarpatho RusynCelticCentral AmericanCentral American IndianCherokeeCheyenneChickasawChileanChineseChippewaChoctawColombianColvilleComancheCosta RicanCreeCreekCroatianCrowCubanCypriotCzechCzechoslovakianDanishDelawareDominicanDutchDutch West IndianEastern EuropeanEcuadorianEgyptianEnglishEstonianEthiopianEuropeanFijianFilipinoFinnishFrenchFrench American IndianFrench CanadianGermanGerman RussianGhanaianGreekGuamanian/ChamorroGuatemalanGuyaneseHaitianHmongHonduranHopiHoumaHungarianIcelanderIndian (Asian)IndonesianInupiatIranianIraqiIrishIroquoisIsraeliItalianJamaicanJapaneseJordanianKenyanKiowaKoreanLaotianLatvianLebaneseLiberianLithuanianLumbeeLuxembourgerMacedonianMalaysianMalteseMarshalleseMenomineeMexicanMexican American IndianMongolianMoroccanNative HawaiianNavajoNepaleseNew ZealanderNicaraguanNigerianNorthern EuropeanNorwegianOkinawanOsageOttawaPaiutePakistaniPalestinianPanamanianParaguayanPennsylvania GermanPeruvianPimaPolishPortuguesePotawatomiPuebloPuerto RicanPuget Sound SalishRomanianRussianSalvadoranSamoanScandinavianScotch-IrishScottishSeminoleSenegaleseSerbianShoshoneSierra LeoneanSiouxSlavicSlovakSloveneSomaliSouth AfricanSouth AmericanSouth American IndianSoviet UnionSpaniardSpanishSpanish AmericanSpanish American IndianSri LankanSubsaharan AfricanSudaneseSwedishSwissSyrianTaiwaneseThaiTlingit-HaidaTohono O'OdhamTonganTrinidadian and TobagonianTsimshianTurkishU.S. Virgin IslanderUgandanUkrainianUruguayanUteVenezuelanVietnameseWelshWest IndianYakamaYaquiYugoslavianYumanYup'ikZimbabwean
Immigration
NonimmigrantsImmigrantsAfghanistanAfricaAlbaniaArgentinaArmeniaAsiaAustraliaAustriaBahamasBangladeshBarbadosBelarusBelgiumBelizeBoliviaBosnia and HerzegovinaBrazilBulgariaBurma/MyanmarCabo VerdeCambodiaCameroonCanadaCaribbeanCentral AmericaChinaColombiaCongoCosta RicaCroatiaCubaCzechoslovakiaDenmarkDominicaDominican RepublicEastern AfricaEastern AsiaEastern EuropeEcuadorEgyptEl SalvadorEnglandEritreaEthiopiaEuropeFijiFranceGermanyGhanaGreeceGrenadaGuatemalaGuyanaHaitiHondurasHong KongHungaryIndiaIndonesiaIranIraqIrelandIsraelItalyJamaicaJapanJordanKazakhstanKenyaKoreaKuwaitLaosLatin AmericaLatviaLebanonLiberiaLithuaniaMalaysiaMexicoMicronesiaMiddle AfricaMoldovaMoroccoNepalNetherlandsNicaraguaNigeriaNorth AmericaNorth MacedoniaNorthern AfricaNorthern EuropeNorwayOceaniaPakistanPanamaPeruPhilippinesPolandPortugalRomaniaRussiaSaudi ArabiaScotlandSenegalSerbiaSierra LeoneSingaporeSomaliaSouth AfricaSouth AmericaSouth Central AsiaSouth Eastern AsiaSouthern EuropeSpainSri LankaSt. Vincent and the GrenadinesSudanSwedenSwitzerlandSyriaTaiwanThailandTrinidad and TobagoTurkeyUgandaUkraineUruguayUzbekistanVenezuelaVietnamWest IndiesWestern AfricaWestern AsiaWestern EuropeYemenZaireZimbabweAzores
Immigrants from Chile
Race
Ancestry
AfghanAfricanAlaska NativeAlaskan AthabascanAlbanianAleutAlsatianAmericanApacheArabArapahoArgentineanArmenianAssyrian/Chaldean/SyriacAustralianAustrianBahamianBangladeshiBarbadianBasqueBelgianBelizeanBermudanBhutaneseBlackfeetBolivianBrazilianBritishBritish West IndianBulgarianBurmeseCajunCambodianCanadianCape VerdeanCarpatho RusynCelticCentral AmericanCentral American IndianCherokeeCheyenneChickasawChileanChineseChippewaChoctawColombianColvilleComancheCosta RicanCreeCreekCroatianCrowCubanCypriotCzechCzechoslovakianDanishDelawareDominicanDutchDutch West IndianEastern EuropeanEcuadorianEgyptianEnglishEstonianEthiopianFijianFilipinoFinnishFrenchFrench American IndianFrench CanadianGermanGerman RussianGhanaianGreekGuamanian/ChamorroGuatemalanGuyaneseHaitianHmongHonduranHopiHoumaHungarianIcelanderIndian (Asian)IndonesianInupiatIranianIraqiIrishIroquoisIsraeliItalianJamaicanJapaneseJordanianKenyanKiowaKoreanLaotianLatvianLebaneseLiberianLithuanianLumbeeLuxembourgerMacedonianMalaysianMalteseMarshalleseMenomineeMexicanMexican American IndianMongolianMoroccanNative HawaiianNavajoNepaleseNew ZealanderNicaraguanNigerianNorthern EuropeanNorwegianOkinawanOsageOttawaPaiutePakistaniPalestinianPanamanianParaguayanPennsylvania GermanPeruvianPimaPolishPortuguesePotawatomiPuebloPuerto RicanPuget Sound SalishRomanianRussianSalvadoranSamoanScandinavianScotch-IrishScottishSeminoleSenegaleseSerbianShoshoneSierra LeoneanSiouxSlavicSlovakSloveneSomaliSouth AfricanSouth AmericanSouth American IndianSoviet UnionSpaniardSpanishSpanish AmericanSpanish American IndianSri LankanSubsaharan AfricanSudaneseSwedishSwissSyrianTaiwaneseThaiTlingit-HaidaTohono O'OdhamTonganTrinidadian and TobagonianTsimshianTurkishU.S. Virgin IslanderUgandanUkrainianUruguayanUteVenezuelanVietnameseWelshWest IndianYakamaYaquiYugoslavianYumanYup'ikZimbabwean
Immigration
NonimmigrantsImmigrantsAfghanistanAfricaAlbaniaArgentinaArmeniaAsiaAustraliaAustriaBahamasBangladeshBarbadosBelarusBelgiumBelizeBoliviaBosnia and HerzegovinaBrazilBulgariaBurma/MyanmarCabo VerdeCambodiaCameroonCanadaCaribbeanCentral AmericaChileChinaColombiaCongoCosta RicaCroatiaCubaCzechoslovakiaDenmarkDominicaDominican RepublicEastern AfricaEastern AsiaEastern EuropeEcuadorEgyptEl SalvadorEnglandEritreaEthiopiaEuropeFijiFranceGermanyGhanaGreeceGrenadaGuatemalaGuyanaHaitiHondurasHong KongHungaryIndiaIndonesiaIranIraqIrelandIsraelItalyJamaicaJapanJordanKazakhstanKenyaKoreaKuwaitLaosLatin AmericaLatviaLebanonLiberiaLithuaniaMalaysiaMexicoMicronesiaMiddle AfricaMoldovaMoroccoNepalNetherlandsNicaraguaNigeriaNorth AmericaNorth MacedoniaNorthern AfricaNorthern EuropeNorwayOceaniaPakistanPanamaPeruPhilippinesPolandPortugalRomaniaRussiaSaudi ArabiaScotlandSenegalSerbiaSierra LeoneSingaporeSomaliaSouth AfricaSouth AmericaSouth Central AsiaSouth Eastern AsiaSouthern EuropeSpainSri LankaSt. Vincent and the GrenadinesSudanSwedenSwitzerlandSyriaTaiwanThailandTrinidad and TobagoTurkeyUgandaUkraineUruguayUzbekistanVenezuelaVietnamWest IndiesWestern AfricaWestern AsiaWestern EuropeYemenZaireZimbabweAzores
Householder Income Ages 45 - 64 years
Income
Poverty
Unemployment
Labor Participation
Family Structure
Vehicle Availability
Education Level
Disability

Householder Income Ages 45 - 64 years Comparison

Europeans

Immigrants from Chile

Exceptional
Excellent
$106,367
HOUSEHOLDER INCOME AGES 45 - 64 YEARS
95.4/ 100
METRIC RATING
113th/ 347
METRIC RANK
$103,412
HOUSEHOLDER INCOME AGES 45 - 64 YEARS
82.5/ 100
METRIC RATING
146th/ 347
METRIC RANK

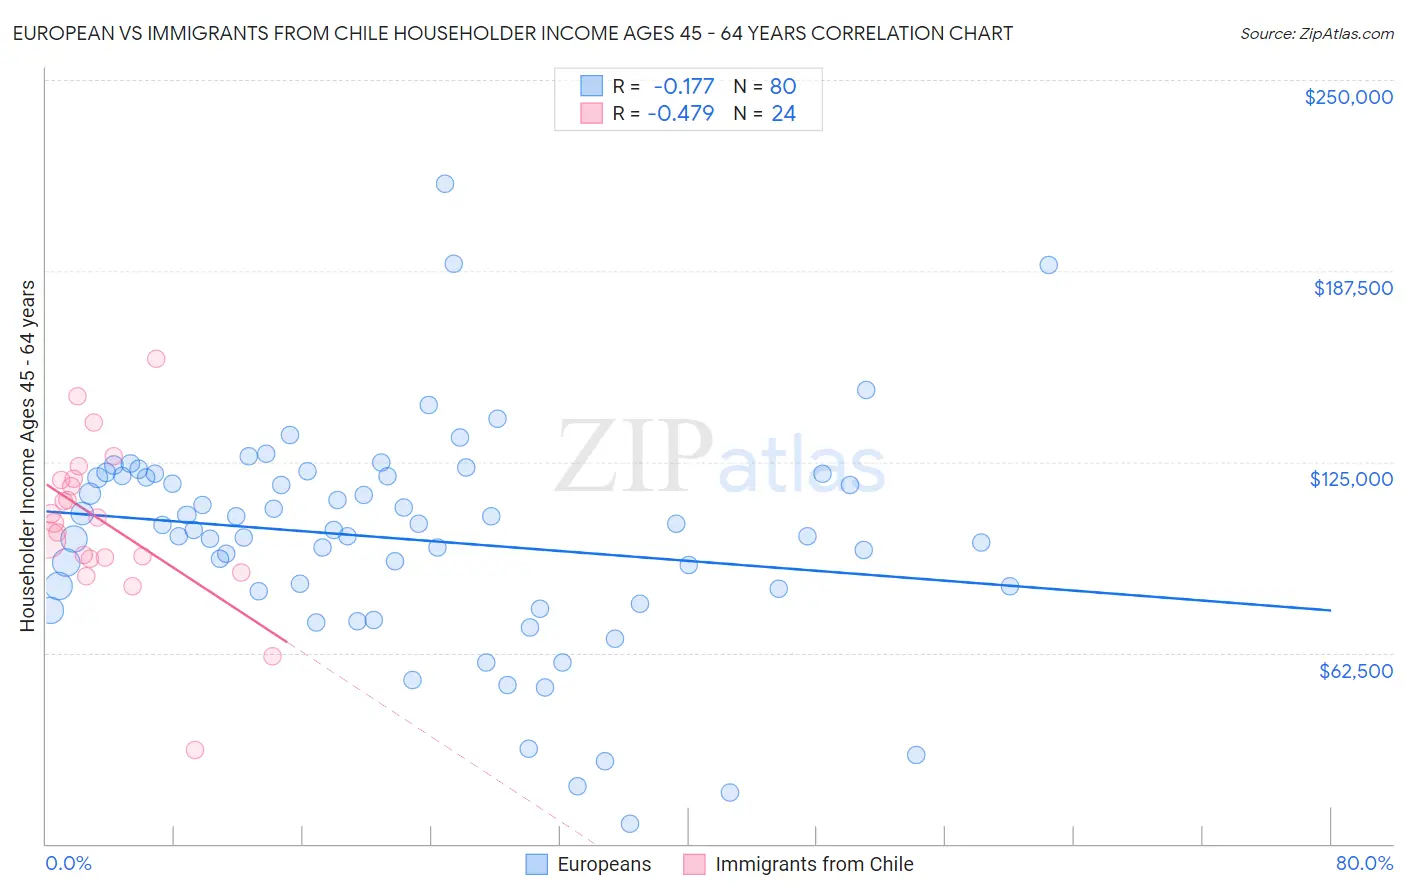
European vs Immigrants from Chile Householder Income Ages 45 - 64 years Correlation Chart

The statistical analysis conducted on geographies consisting of 558,626,561 people shows a poor negative correlation between the proportion of Europeans and household income with householder between the ages 45 and 64 in the United States with a correlation coefficient (R) of -0.177 and weighted average of $106,367. Similarly, the statistical analysis conducted on geographies consisting of 218,523,915 people shows a moderate negative correlation between the proportion of Immigrants from Chile and household income with householder between the ages 45 and 64 in the United States with a correlation coefficient (R) of -0.479 and weighted average of $103,412, a difference of 2.9%.
European vs Immigrants from Chile Householder Income Ages 45 - 64 years

Householder Income Ages 45 - 64 years Correlation Summary

MeasurementEuropeanImmigrants from Chile
Minimum$6,604$30,865
Maximum$216,139$158,750
Range$209,535$127,885
Mean$99,691$105,152
Median$102,766$105,926
Interquartile 25% (IQ1)$82,969$93,461
Interquartile 75% (IQ3)$120,255$119,302
Interquartile Range (IQR)$37,286$25,840
Standard Deviation (Sample)$35,975$26,462
Standard Deviation (Population)$35,750$25,904

Similar Demographics by Householder Income Ages 45 - 64 years

Demographics Similar to Europeans by Householder Income Ages 45 - 64 years

In terms of householder income ages 45 - 64 years, the demographic groups most similar to Europeans are Swedish ($106,377, a difference of 0.010%), Immigrants from Vietnam ($106,417, a difference of 0.050%), Immigrants from Poland ($106,319, a difference of 0.050%), Immigrants from Kuwait ($106,285, a difference of 0.080%), and Immigrants from Brazil ($106,470, a difference of 0.10%).
DemographicsRating | RankHouseholder Income Ages 45 - 64 years
Armenians
96.6
/100
|
#106
Exceptional
$107,002
Immigrants | Fiji
96.5
/100
|
#107
Exceptional
$106,952
Zimbabweans
96.3
/100
|
#108
Exceptional
$106,849
Chileans
95.9
/100
|
#109
Exceptional
$106,611
Immigrants | Brazil
95.6
/100
|
#110
Exceptional
$106,470
Immigrants | Vietnam
95.5
/100
|
#111
Exceptional
$106,417
Swedes
95.4
/100
|
#112
Exceptional
$106,377
Europeans
95.4
/100
|
#113
Exceptional
$106,367
Immigrants | Poland
95.3
/100
|
#114
Exceptional
$106,319
Immigrants | Kuwait
95.2
/100
|
#115
Exceptional
$106,285
British
95.2
/100
|
#116
Exceptional
$106,264
Albanians
95.1
/100
|
#117
Exceptional
$106,243
Immigrants | Western Asia
95.0
/100
|
#118
Exceptional
$106,217
Immigrants | Jordan
94.9
/100
|
#119
Exceptional
$106,164
Immigrants | South Eastern Asia
94.8
/100
|
#120
Exceptional
$106,109

Demographics Similar to Immigrants from Chile by Householder Income Ages 45 - 64 years

In terms of householder income ages 45 - 64 years, the demographic groups most similar to Immigrants from Chile are Basque ($103,387, a difference of 0.020%), Ugandan ($103,472, a difference of 0.060%), Czech ($103,507, a difference of 0.090%), Serbian ($103,522, a difference of 0.11%), and Luxembourger ($103,536, a difference of 0.12%).
DemographicsRating | RankHouseholder Income Ages 45 - 64 years
Immigrants | Oceania
84.5
/100
|
#139
Excellent
$103,705
Norwegians
84.3
/100
|
#140
Excellent
$103,682
Immigrants | Uganda
83.7
/100
|
#141
Excellent
$103,584
Luxembourgers
83.3
/100
|
#142
Excellent
$103,536
Serbians
83.2
/100
|
#143
Excellent
$103,522
Czechs
83.1
/100
|
#144
Excellent
$103,507
Ugandans
82.9
/100
|
#145
Excellent
$103,472
Immigrants | Chile
82.5
/100
|
#146
Excellent
$103,412
Basques
82.3
/100
|
#147
Excellent
$103,387
Immigrants | Germany
81.5
/100
|
#148
Excellent
$103,282
Immigrants | Sierra Leone
81.1
/100
|
#149
Excellent
$103,227
Immigrants | Peru
80.7
/100
|
#150
Excellent
$103,173
Swiss
79.9
/100
|
#151
Good
$103,071
Irish
79.8
/100
|
#152
Good
$103,067
Scandinavians
79.0
/100
|
#153
Good
$102,969