Yuman vs Immigrants from Switzerland Median Earnings
COMPARE
Yuman
Immigrants from Switzerland
Median Earnings
Median Earnings Comparison
Yuman
Immigrants from Switzerland
$39,523
MEDIAN EARNINGS
0.0/ 100
METRIC RATING
327th/ 347
METRIC RANK
$53,211
MEDIAN EARNINGS
100.0/ 100
METRIC RATING
35th/ 347
METRIC RANK
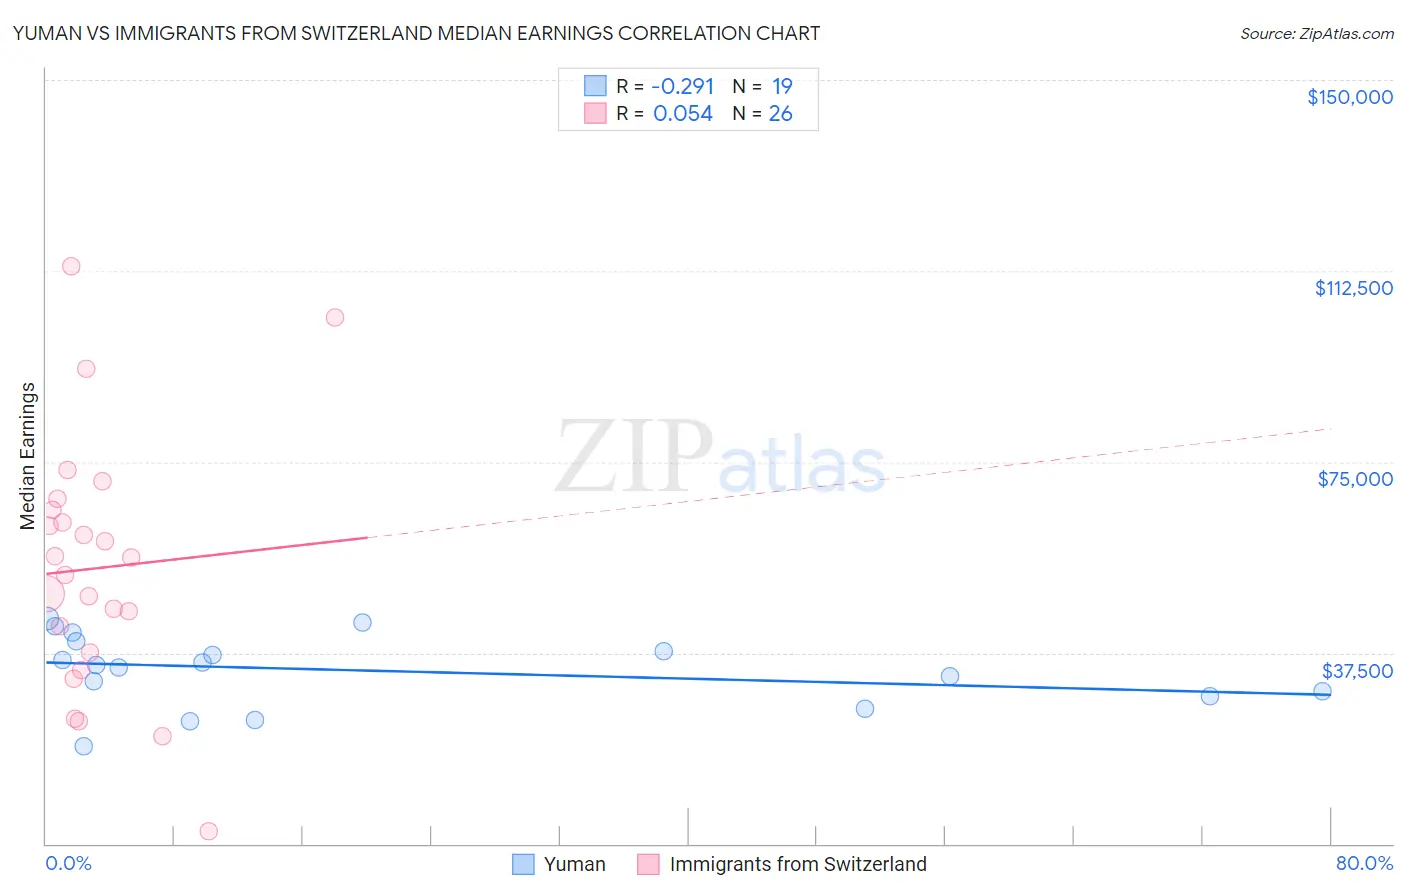
Yuman vs Immigrants from Switzerland Median Earnings Correlation Chart
The statistical analysis conducted on geographies consisting of 40,694,380 people shows a weak negative correlation between the proportion of Yuman and median earnings in the United States with a correlation coefficient (R) of -0.291 and weighted average of $39,523. Similarly, the statistical analysis conducted on geographies consisting of 148,076,857 people shows a slight positive correlation between the proportion of Immigrants from Switzerland and median earnings in the United States with a correlation coefficient (R) of 0.054 and weighted average of $53,211, a difference of 34.6%.
Median Earnings Correlation Summary
| Measurement | Yuman | Immigrants from Switzerland |
| Minimum | $19,239 | $2,499 |
| Maximum | $44,204 | $113,419 |
| Range | $24,965 | $110,920 |
| Mean | $34,023 | $54,118 |
| Median | $35,154 | $54,480 |
| Interquartile 25% (IQ1) | $29,007 | $37,656 |
| Interquartile 75% (IQ3) | $39,859 | $65,606 |
| Interquartile Range (IQR) | $10,852 | $27,950 |
| Standard Deviation (Sample) | $7,101 | $25,059 |
| Standard Deviation (Population) | $6,912 | $24,573 |
Similar Demographics by Median Earnings
Demographics Similar to Yuman by Median Earnings
In terms of median earnings, the demographic groups most similar to Yuman are Immigrants from Yemen ($39,540, a difference of 0.040%), Sioux ($39,448, a difference of 0.19%), Creek ($39,648, a difference of 0.32%), Ottawa ($39,721, a difference of 0.50%), and Bahamian ($39,735, a difference of 0.54%).
| Demographics | Rating | Rank | Median Earnings |
| Immigrants | Bahamas | 0.0 /100 | #320 | Tragic $39,861 |
| Mexicans | 0.0 /100 | #321 | Tragic $39,834 |
| Immigrants | Central America | 0.0 /100 | #322 | Tragic $39,762 |
| Bahamians | 0.0 /100 | #323 | Tragic $39,735 |
| Ottawa | 0.0 /100 | #324 | Tragic $39,721 |
| Creek | 0.0 /100 | #325 | Tragic $39,648 |
| Immigrants | Yemen | 0.0 /100 | #326 | Tragic $39,540 |
| Yuman | 0.0 /100 | #327 | Tragic $39,523 |
| Sioux | 0.0 /100 | #328 | Tragic $39,448 |
| Kiowa | 0.0 /100 | #329 | Tragic $39,232 |
| Immigrants | Congo | 0.0 /100 | #330 | Tragic $39,169 |
| Immigrants | Mexico | 0.0 /100 | #331 | Tragic $39,114 |
| Yakama | 0.0 /100 | #332 | Tragic $39,107 |
| Houma | 0.0 /100 | #333 | Tragic $38,949 |
| Spanish American Indians | 0.0 /100 | #334 | Tragic $38,907 |
Demographics Similar to Immigrants from Switzerland by Median Earnings
In terms of median earnings, the demographic groups most similar to Immigrants from Switzerland are Immigrants from Denmark ($53,186, a difference of 0.050%), Immigrants from Sri Lanka ($53,268, a difference of 0.11%), Immigrants from Greece ($53,282, a difference of 0.13%), Immigrants from Asia ($53,310, a difference of 0.19%), and Russian ($53,334, a difference of 0.23%).
| Demographics | Rating | Rank | Median Earnings |
| Immigrants | France | 100.0 /100 | #28 | Exceptional $53,490 |
| Immigrants | Russia | 100.0 /100 | #29 | Exceptional $53,457 |
| Cambodians | 100.0 /100 | #30 | Exceptional $53,386 |
| Russians | 100.0 /100 | #31 | Exceptional $53,334 |
| Immigrants | Asia | 100.0 /100 | #32 | Exceptional $53,310 |
| Immigrants | Greece | 100.0 /100 | #33 | Exceptional $53,282 |
| Immigrants | Sri Lanka | 100.0 /100 | #34 | Exceptional $53,268 |
| Immigrants | Switzerland | 100.0 /100 | #35 | Exceptional $53,211 |
| Immigrants | Denmark | 100.0 /100 | #36 | Exceptional $53,186 |
| Immigrants | Belarus | 100.0 /100 | #37 | Exceptional $53,043 |
| Latvians | 100.0 /100 | #38 | Exceptional $53,001 |
| Immigrants | Turkey | 100.0 /100 | #39 | Exceptional $52,960 |
| Israelis | 100.0 /100 | #40 | Exceptional $52,937 |
| Immigrants | Lithuania | 100.0 /100 | #41 | Exceptional $52,769 |
| Maltese | 100.0 /100 | #42 | Exceptional $52,526 |