Yuman vs Eastern European Median Earnings
COMPARE
Yuman
Eastern European
Median Earnings
Median Earnings Comparison
Yuman
Eastern Europeans
$39,523
MEDIAN EARNINGS
0.0/ 100
METRIC RATING
327th/ 347
METRIC RANK
$55,084
MEDIAN EARNINGS
100.0/ 100
METRIC RATING
17th/ 347
METRIC RANK
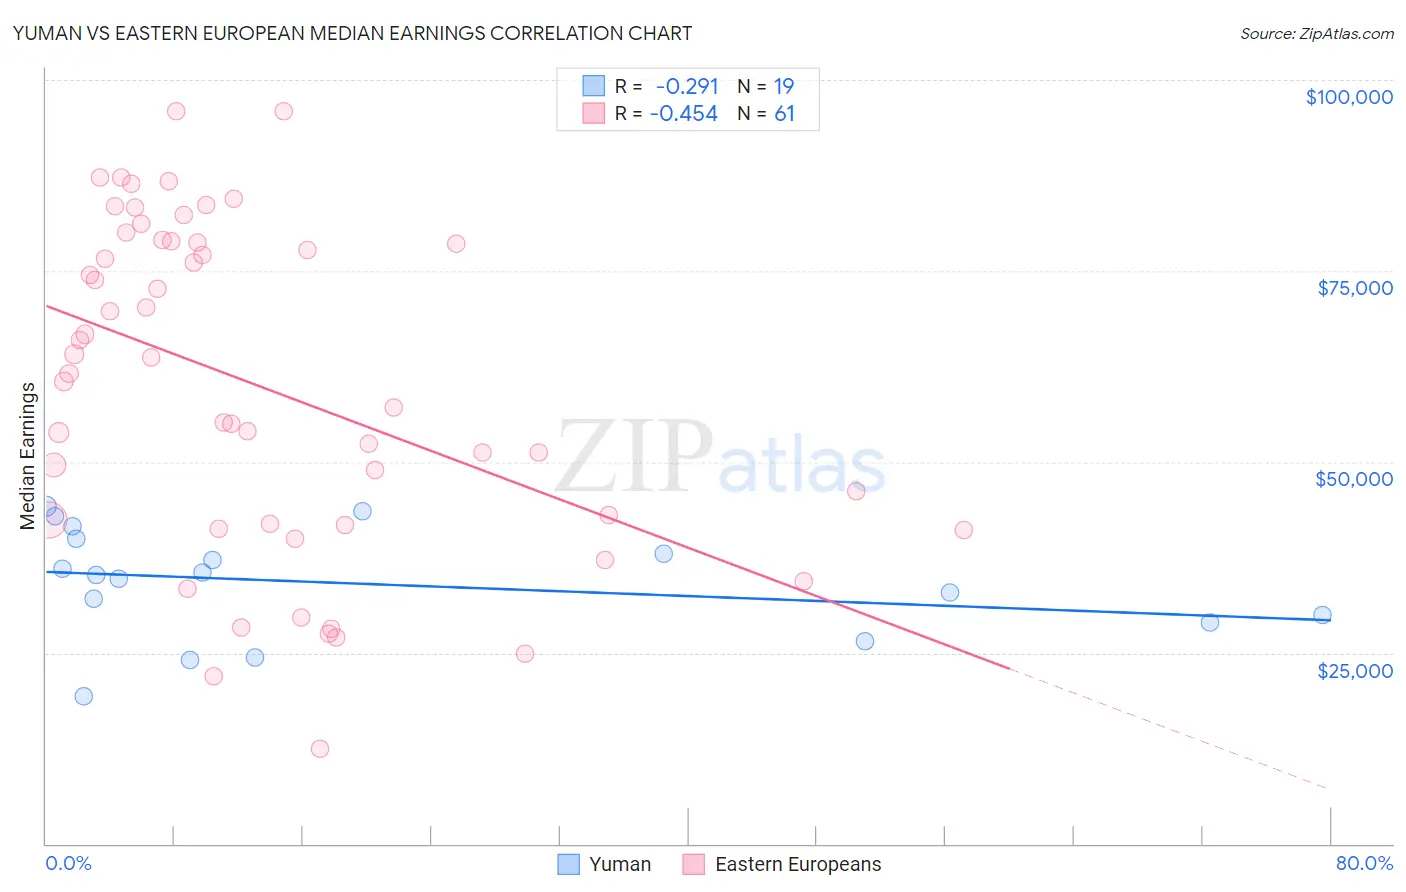
Yuman vs Eastern European Median Earnings Correlation Chart
The statistical analysis conducted on geographies consisting of 40,694,380 people shows a weak negative correlation between the proportion of Yuman and median earnings in the United States with a correlation coefficient (R) of -0.291 and weighted average of $39,523. Similarly, the statistical analysis conducted on geographies consisting of 461,197,031 people shows a moderate negative correlation between the proportion of Eastern Europeans and median earnings in the United States with a correlation coefficient (R) of -0.454 and weighted average of $55,084, a difference of 39.4%.
Median Earnings Correlation Summary
| Measurement | Yuman | Eastern European |
| Minimum | $19,239 | $12,500 |
| Maximum | $44,204 | $95,935 |
| Range | $24,965 | $83,435 |
| Mean | $34,023 | $59,916 |
| Median | $35,154 | $61,581 |
| Interquartile 25% (IQ1) | $29,007 | $41,817 |
| Interquartile 75% (IQ3) | $39,859 | $78,787 |
| Interquartile Range (IQR) | $10,852 | $36,970 |
| Standard Deviation (Sample) | $7,101 | $21,428 |
| Standard Deviation (Population) | $6,912 | $21,251 |
Similar Demographics by Median Earnings
Demographics Similar to Yuman by Median Earnings
In terms of median earnings, the demographic groups most similar to Yuman are Immigrants from Yemen ($39,540, a difference of 0.040%), Sioux ($39,448, a difference of 0.19%), Creek ($39,648, a difference of 0.32%), Ottawa ($39,721, a difference of 0.50%), and Bahamian ($39,735, a difference of 0.54%).
| Demographics | Rating | Rank | Median Earnings |
| Immigrants | Bahamas | 0.0 /100 | #320 | Tragic $39,861 |
| Mexicans | 0.0 /100 | #321 | Tragic $39,834 |
| Immigrants | Central America | 0.0 /100 | #322 | Tragic $39,762 |
| Bahamians | 0.0 /100 | #323 | Tragic $39,735 |
| Ottawa | 0.0 /100 | #324 | Tragic $39,721 |
| Creek | 0.0 /100 | #325 | Tragic $39,648 |
| Immigrants | Yemen | 0.0 /100 | #326 | Tragic $39,540 |
| Yuman | 0.0 /100 | #327 | Tragic $39,523 |
| Sioux | 0.0 /100 | #328 | Tragic $39,448 |
| Kiowa | 0.0 /100 | #329 | Tragic $39,232 |
| Immigrants | Congo | 0.0 /100 | #330 | Tragic $39,169 |
| Immigrants | Mexico | 0.0 /100 | #331 | Tragic $39,114 |
| Yakama | 0.0 /100 | #332 | Tragic $39,107 |
| Houma | 0.0 /100 | #333 | Tragic $38,949 |
| Spanish American Indians | 0.0 /100 | #334 | Tragic $38,907 |
Demographics Similar to Eastern Europeans by Median Earnings
In terms of median earnings, the demographic groups most similar to Eastern Europeans are Immigrants from Japan ($54,938, a difference of 0.26%), Immigrants from Belgium ($54,679, a difference of 0.74%), Cypriot ($54,589, a difference of 0.91%), Burmese ($54,559, a difference of 0.96%), and Immigrants from Korea ($54,530, a difference of 1.0%).
| Demographics | Rating | Rank | Median Earnings |
| Immigrants | South Central Asia | 100.0 /100 | #10 | Exceptional $57,114 |
| Immigrants | Israel | 100.0 /100 | #11 | Exceptional $57,034 |
| Immigrants | Ireland | 100.0 /100 | #12 | Exceptional $56,854 |
| Immigrants | China | 100.0 /100 | #13 | Exceptional $56,638 |
| Immigrants | Australia | 100.0 /100 | #14 | Exceptional $56,305 |
| Indians (Asian) | 100.0 /100 | #15 | Exceptional $56,253 |
| Immigrants | Eastern Asia | 100.0 /100 | #16 | Exceptional $56,183 |
| Eastern Europeans | 100.0 /100 | #17 | Exceptional $55,084 |
| Immigrants | Japan | 100.0 /100 | #18 | Exceptional $54,938 |
| Immigrants | Belgium | 100.0 /100 | #19 | Exceptional $54,679 |
| Cypriots | 100.0 /100 | #20 | Exceptional $54,589 |
| Burmese | 100.0 /100 | #21 | Exceptional $54,559 |
| Immigrants | Korea | 100.0 /100 | #22 | Exceptional $54,530 |
| Immigrants | Sweden | 100.0 /100 | #23 | Exceptional $54,478 |
| Soviet Union | 100.0 /100 | #24 | Exceptional $54,290 |