Yuman vs Immigrants from West Indies 9th Grade
COMPARE
Yuman
Immigrants from West Indies
9th Grade
9th Grade Comparison
Yuman
Immigrants from West Indies
93.8%
9TH GRADE
0.2/ 100
METRIC RATING
270th/ 347
METRIC RANK
93.3%
9TH GRADE
0.0/ 100
METRIC RATING
289th/ 347
METRIC RANK
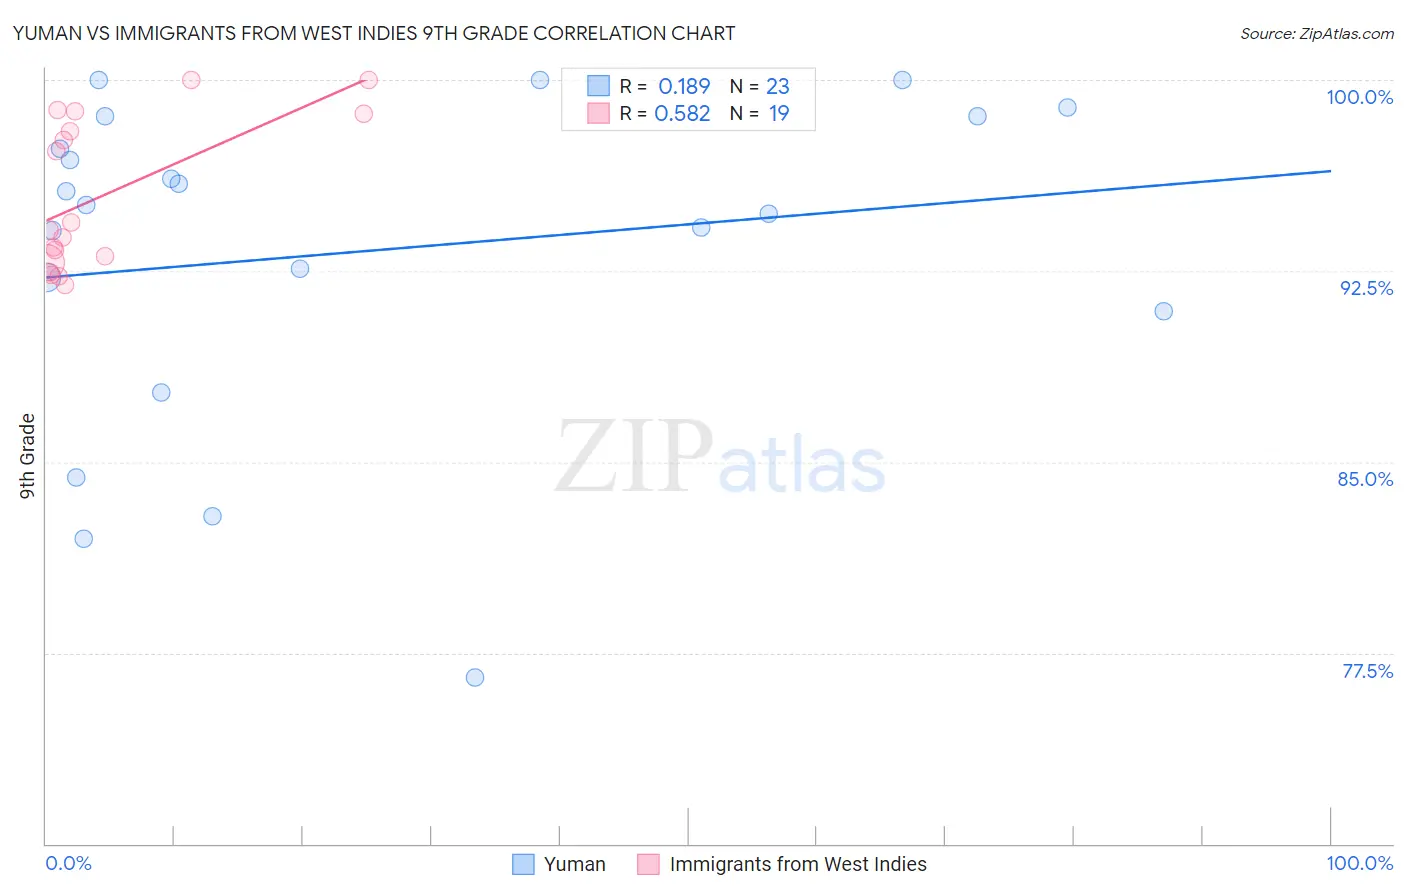
Yuman vs Immigrants from West Indies 9th Grade Correlation Chart
The statistical analysis conducted on geographies consisting of 40,696,349 people shows a poor positive correlation between the proportion of Yuman and percentage of population with at least 9th grade education in the United States with a correlation coefficient (R) of 0.189 and weighted average of 93.8%. Similarly, the statistical analysis conducted on geographies consisting of 72,457,514 people shows a substantial positive correlation between the proportion of Immigrants from West Indies and percentage of population with at least 9th grade education in the United States with a correlation coefficient (R) of 0.582 and weighted average of 93.3%, a difference of 0.57%.
9th Grade Correlation Summary
| Measurement | Yuman | Immigrants from West Indies |
| Minimum | 76.5% | 92.0% |
| Maximum | 100.0% | 100.0% |
| Range | 23.5% | 8.0% |
| Mean | 93.3% | 95.4% |
| Median | 95.1% | 94.1% |
| Interquartile 25% (IQ1) | 90.9% | 92.8% |
| Interquartile 75% (IQ3) | 98.6% | 98.7% |
| Interquartile Range (IQR) | 7.7% | 5.8% |
| Standard Deviation (Sample) | 6.4% | 2.9% |
| Standard Deviation (Population) | 6.3% | 2.9% |
Demographics Similar to Yuman and Immigrants from West Indies by 9th Grade
In terms of 9th grade, the demographic groups most similar to Yuman are Immigrants from Uruguay (93.8%, a difference of 0.010%), Immigrants from Ghana (93.8%, a difference of 0.020%), Immigrants from Western Africa (93.8%, a difference of 0.030%), Immigrants from South America (93.8%, a difference of 0.040%), and Peruvian (93.8%, a difference of 0.040%). Similarly, the demographic groups most similar to Immigrants from West Indies are Immigrants from South Eastern Asia (93.3%, a difference of 0.060%), Immigrants from St. Vincent and the Grenadines (93.4%, a difference of 0.090%), Immigrants from Barbados (93.4%, a difference of 0.10%), Immigrants from Peru (93.4%, a difference of 0.14%), and Bangladeshi (93.4%, a difference of 0.18%).
| Demographics | Rating | Rank | 9th Grade |
| Immigrants | Uruguay | 0.2 /100 | #269 | Tragic 93.8% |
| Yuman | 0.2 /100 | #270 | Tragic 93.8% |
| Immigrants | Ghana | 0.2 /100 | #271 | Tragic 93.8% |
| Immigrants | Western Africa | 0.2 /100 | #272 | Tragic 93.8% |
| Immigrants | South America | 0.2 /100 | #273 | Tragic 93.8% |
| Peruvians | 0.2 /100 | #274 | Tragic 93.8% |
| Immigrants | Colombia | 0.2 /100 | #275 | Tragic 93.8% |
| West Indians | 0.2 /100 | #276 | Tragic 93.7% |
| Immigrants | Philippines | 0.1 /100 | #277 | Tragic 93.7% |
| Immigrants | Eritrea | 0.1 /100 | #278 | Tragic 93.7% |
| Trinidadians and Tobagonians | 0.1 /100 | #279 | Tragic 93.7% |
| Taiwanese | 0.1 /100 | #280 | Tragic 93.6% |
| Immigrants | Trinidad and Tobago | 0.1 /100 | #281 | Tragic 93.6% |
| Malaysians | 0.0 /100 | #282 | Tragic 93.5% |
| Barbadians | 0.0 /100 | #283 | Tragic 93.5% |
| Bangladeshis | 0.0 /100 | #284 | Tragic 93.4% |
| Immigrants | Peru | 0.0 /100 | #285 | Tragic 93.4% |
| Immigrants | Barbados | 0.0 /100 | #286 | Tragic 93.4% |
| Immigrants | St. Vincent and the Grenadines | 0.0 /100 | #287 | Tragic 93.4% |
| Immigrants | South Eastern Asia | 0.0 /100 | #288 | Tragic 93.3% |
| Immigrants | West Indies | 0.0 /100 | #289 | Tragic 93.3% |