Scotch-Irish vs Immigrants from Armenia Median Male Earnings
COMPARE
Scotch-Irish
Immigrants from Armenia
Median Male Earnings
Median Male Earnings Comparison
Scotch-Irish
Immigrants from Armenia
$53,658
MEDIAN MALE EARNINGS
30.6/ 100
METRIC RATING
192nd/ 347
METRIC RANK
$51,793
MEDIAN MALE EARNINGS
6.6/ 100
METRIC RATING
220th/ 347
METRIC RANK
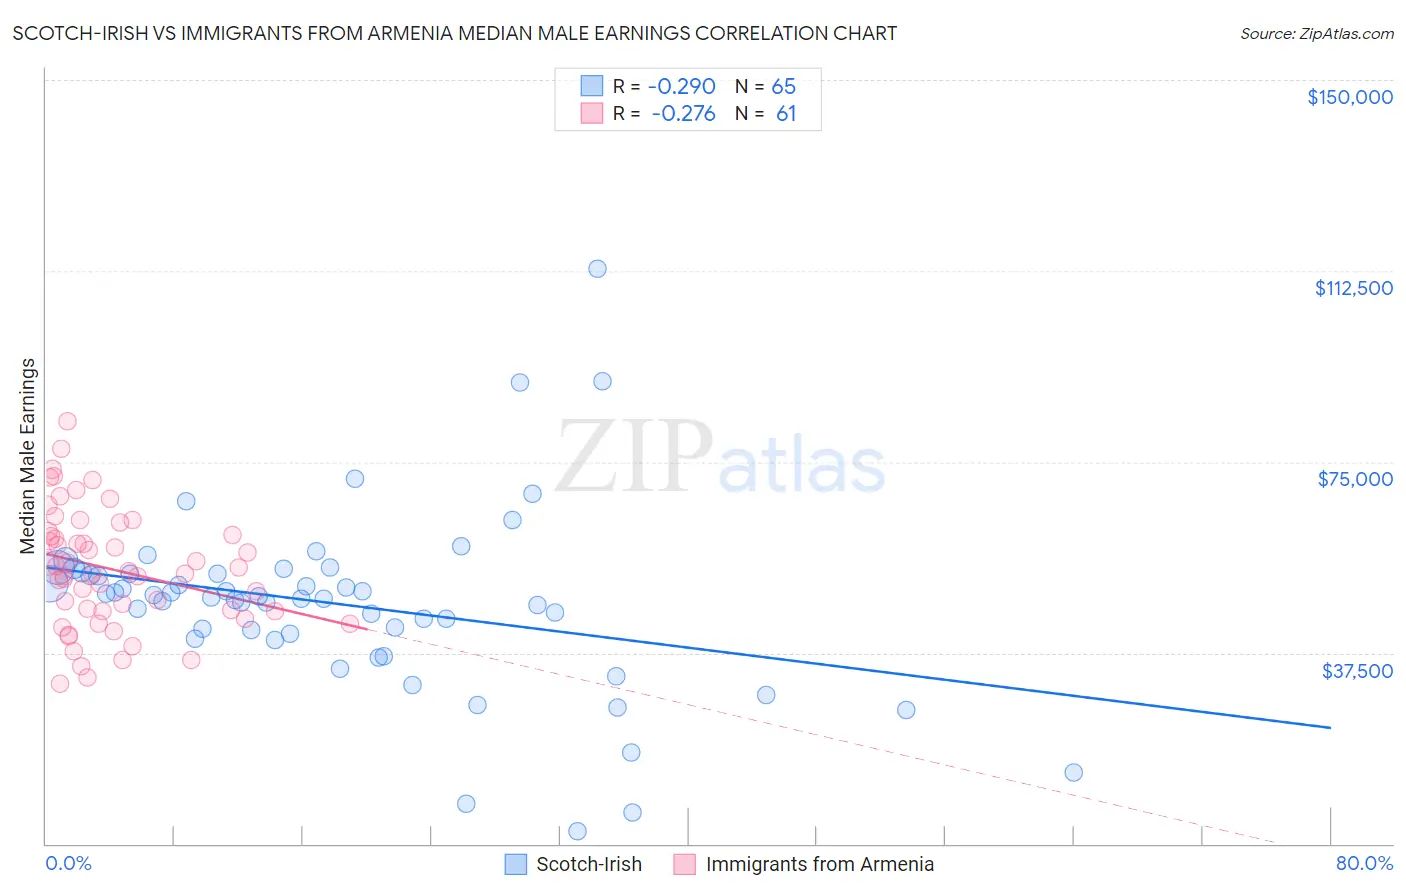
Scotch-Irish vs Immigrants from Armenia Median Male Earnings Correlation Chart
The statistical analysis conducted on geographies consisting of 547,724,250 people shows a weak negative correlation between the proportion of Scotch-Irish and median male earnings in the United States with a correlation coefficient (R) of -0.290 and weighted average of $53,658. Similarly, the statistical analysis conducted on geographies consisting of 97,713,127 people shows a weak negative correlation between the proportion of Immigrants from Armenia and median male earnings in the United States with a correlation coefficient (R) of -0.276 and weighted average of $51,793, a difference of 3.6%.
Median Male Earnings Correlation Summary
| Measurement | Scotch-Irish | Immigrants from Armenia |
| Minimum | $2,499 | $31,379 |
| Maximum | $113,000 | $83,085 |
| Range | $110,501 | $51,706 |
| Mean | $47,040 | $53,967 |
| Median | $48,432 | $53,459 |
| Interquartile 25% (IQ1) | $40,813 | $45,624 |
| Interquartile 75% (IQ3) | $53,223 | $61,019 |
| Interquartile Range (IQR) | $12,411 | $15,395 |
| Standard Deviation (Sample) | $17,914 | $11,610 |
| Standard Deviation (Population) | $17,776 | $11,514 |
Similar Demographics by Median Male Earnings
Demographics Similar to Scotch-Irish by Median Male Earnings
In terms of median male earnings, the demographic groups most similar to Scotch-Irish are Guamanian/Chamorro ($53,661, a difference of 0.010%), Kenyan ($53,647, a difference of 0.020%), Uruguayan ($53,680, a difference of 0.040%), Puget Sound Salish ($53,704, a difference of 0.090%), and Immigrants from Eastern Africa ($53,713, a difference of 0.10%).
| Demographics | Rating | Rank | Median Male Earnings |
| Immigrants | Sierra Leone | 36.0 /100 | #185 | Fair $53,905 |
| Colombians | 34.4 /100 | #186 | Fair $53,832 |
| Immigrants | Eritrea | 31.8 /100 | #187 | Fair $53,715 |
| Immigrants | Eastern Africa | 31.8 /100 | #188 | Fair $53,713 |
| Puget Sound Salish | 31.6 /100 | #189 | Fair $53,704 |
| Uruguayans | 31.1 /100 | #190 | Fair $53,680 |
| Guamanians/Chamorros | 30.7 /100 | #191 | Fair $53,661 |
| Scotch-Irish | 30.6 /100 | #192 | Fair $53,658 |
| Kenyans | 30.4 /100 | #193 | Fair $53,647 |
| Spanish | 29.0 /100 | #194 | Fair $53,576 |
| Immigrants | Azores | 27.5 /100 | #195 | Fair $53,503 |
| Immigrants | Africa | 26.6 /100 | #196 | Fair $53,457 |
| Immigrants | Kenya | 26.0 /100 | #197 | Fair $53,427 |
| Immigrants | Costa Rica | 22.6 /100 | #198 | Fair $53,237 |
| Tongans | 22.3 /100 | #199 | Fair $53,218 |
Demographics Similar to Immigrants from Armenia by Median Male Earnings
In terms of median male earnings, the demographic groups most similar to Immigrants from Armenia are Immigrants from Ghana ($51,836, a difference of 0.080%), Immigrants from Senegal ($51,647, a difference of 0.28%), Immigrants from Bangladesh ($51,642, a difference of 0.29%), Immigrants from Panama ($51,962, a difference of 0.33%), and Ecuadorian ($51,596, a difference of 0.38%).
| Demographics | Rating | Rank | Median Male Earnings |
| Native Hawaiians | 10.5 /100 | #213 | Poor $52,306 |
| Immigrants | Nonimmigrants | 9.3 /100 | #214 | Tragic $52,170 |
| Immigrants | Cameroon | 8.9 /100 | #215 | Tragic $52,119 |
| Immigrants | Venezuela | 8.3 /100 | #216 | Tragic $52,041 |
| Nigerians | 8.3 /100 | #217 | Tragic $52,039 |
| Immigrants | Panama | 7.7 /100 | #218 | Tragic $51,962 |
| Immigrants | Ghana | 6.9 /100 | #219 | Tragic $51,836 |
| Immigrants | Armenia | 6.6 /100 | #220 | Tragic $51,793 |
| Immigrants | Senegal | 5.8 /100 | #221 | Tragic $51,647 |
| Immigrants | Bangladesh | 5.8 /100 | #222 | Tragic $51,642 |
| Ecuadorians | 5.5 /100 | #223 | Tragic $51,596 |
| Immigrants | Cambodia | 5.5 /100 | #224 | Tragic $51,594 |
| Immigrants | Sudan | 5.0 /100 | #225 | Tragic $51,489 |
| Japanese | 4.9 /100 | #226 | Tragic $51,473 |
| Trinidadians and Tobagonians | 4.8 /100 | #227 | Tragic $51,446 |