Pakistani vs Immigrants from Armenia Median Male Earnings
COMPARE
Pakistani
Immigrants from Armenia
Median Male Earnings
Median Male Earnings Comparison
Pakistanis
Immigrants from Armenia
$56,719
MEDIAN MALE EARNINGS
89.9/ 100
METRIC RATING
129th/ 347
METRIC RANK
$51,793
MEDIAN MALE EARNINGS
6.6/ 100
METRIC RATING
220th/ 347
METRIC RANK
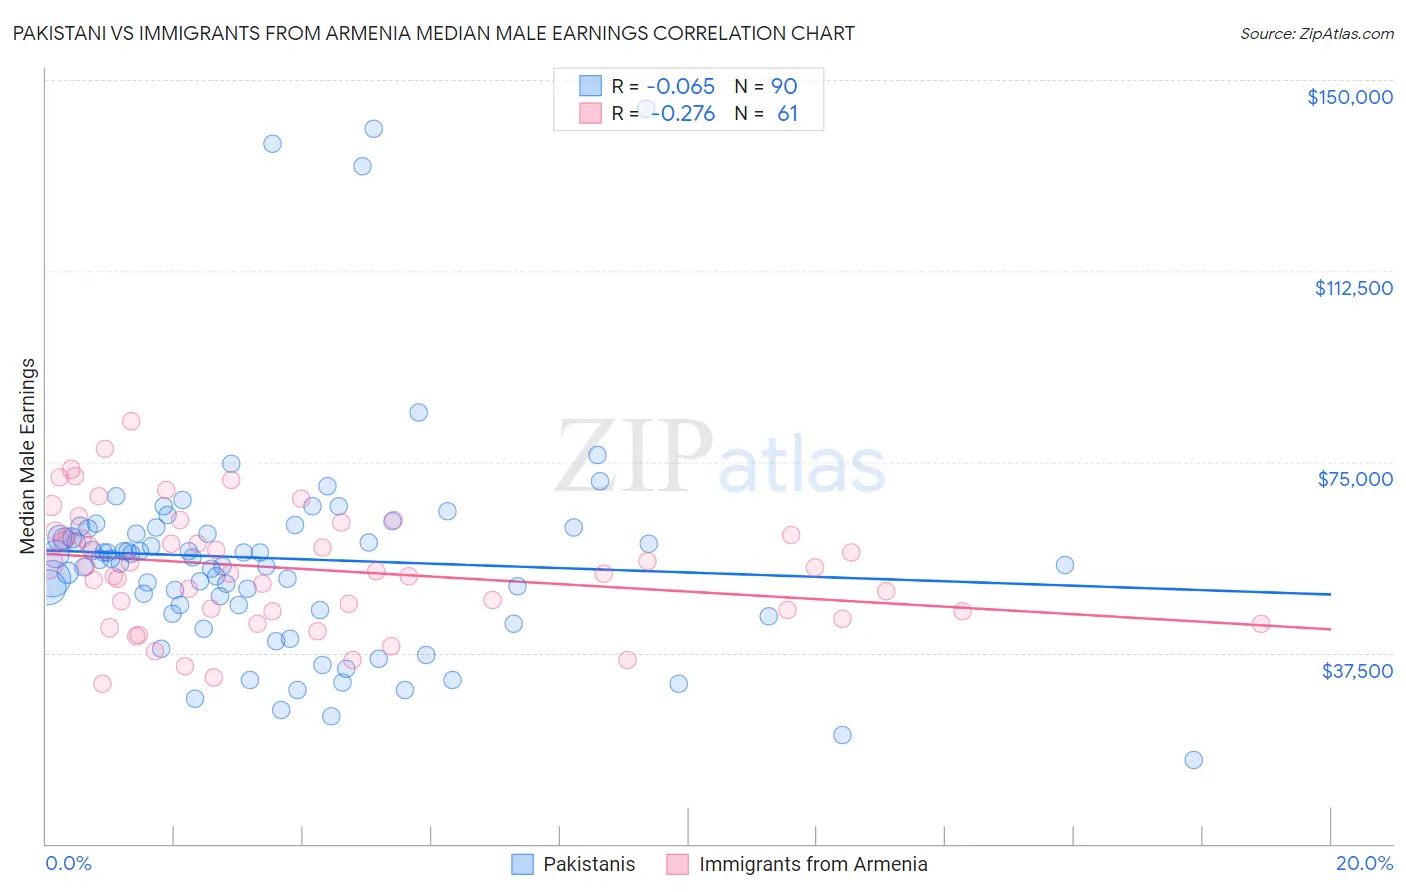
Pakistani vs Immigrants from Armenia Median Male Earnings Correlation Chart
The statistical analysis conducted on geographies consisting of 335,324,155 people shows a slight negative correlation between the proportion of Pakistanis and median male earnings in the United States with a correlation coefficient (R) of -0.065 and weighted average of $56,719. Similarly, the statistical analysis conducted on geographies consisting of 97,713,127 people shows a weak negative correlation between the proportion of Immigrants from Armenia and median male earnings in the United States with a correlation coefficient (R) of -0.276 and weighted average of $51,793, a difference of 9.5%.
Median Male Earnings Correlation Summary
| Measurement | Pakistani | Immigrants from Armenia |
| Minimum | $16,406 | $31,379 |
| Maximum | $144,236 | $83,085 |
| Range | $127,830 | $51,706 |
| Mean | $56,003 | $53,967 |
| Median | $55,878 | $53,459 |
| Interquartile 25% (IQ1) | $45,960 | $45,624 |
| Interquartile 75% (IQ3) | $61,933 | $61,019 |
| Interquartile Range (IQR) | $15,973 | $15,395 |
| Standard Deviation (Sample) | $22,100 | $11,610 |
| Standard Deviation (Population) | $21,977 | $11,514 |
Similar Demographics by Median Male Earnings
Demographics Similar to Pakistanis by Median Male Earnings
In terms of median male earnings, the demographic groups most similar to Pakistanis are Korean ($56,672, a difference of 0.080%), Portuguese ($56,663, a difference of 0.10%), Immigrants from Syria ($56,830, a difference of 0.20%), Brazilian ($56,837, a difference of 0.21%), and Chinese ($56,872, a difference of 0.27%).
| Demographics | Rating | Rank | Median Male Earnings |
| Immigrants | Jordan | 93.1 /100 | #122 | Exceptional $57,145 |
| Slovenes | 93.1 /100 | #123 | Exceptional $57,145 |
| Chileans | 91.9 /100 | #124 | Exceptional $56,973 |
| Immigrants | Morocco | 91.8 /100 | #125 | Exceptional $56,958 |
| Chinese | 91.1 /100 | #126 | Exceptional $56,872 |
| Brazilians | 90.9 /100 | #127 | Exceptional $56,837 |
| Immigrants | Syria | 90.8 /100 | #128 | Exceptional $56,830 |
| Pakistanis | 89.9 /100 | #129 | Excellent $56,719 |
| Koreans | 89.4 /100 | #130 | Excellent $56,672 |
| Portuguese | 89.4 /100 | #131 | Excellent $56,663 |
| Czechs | 88.2 /100 | #132 | Excellent $56,546 |
| Immigrants | Germany | 88.2 /100 | #133 | Excellent $56,542 |
| Moroccans | 87.7 /100 | #134 | Excellent $56,499 |
| Irish | 87.4 /100 | #135 | Excellent $56,464 |
| Immigrants | Saudi Arabia | 87.2 /100 | #136 | Excellent $56,452 |
Demographics Similar to Immigrants from Armenia by Median Male Earnings
In terms of median male earnings, the demographic groups most similar to Immigrants from Armenia are Immigrants from Ghana ($51,836, a difference of 0.080%), Immigrants from Senegal ($51,647, a difference of 0.28%), Immigrants from Bangladesh ($51,642, a difference of 0.29%), Immigrants from Panama ($51,962, a difference of 0.33%), and Ecuadorian ($51,596, a difference of 0.38%).
| Demographics | Rating | Rank | Median Male Earnings |
| Native Hawaiians | 10.5 /100 | #213 | Poor $52,306 |
| Immigrants | Nonimmigrants | 9.3 /100 | #214 | Tragic $52,170 |
| Immigrants | Cameroon | 8.9 /100 | #215 | Tragic $52,119 |
| Immigrants | Venezuela | 8.3 /100 | #216 | Tragic $52,041 |
| Nigerians | 8.3 /100 | #217 | Tragic $52,039 |
| Immigrants | Panama | 7.7 /100 | #218 | Tragic $51,962 |
| Immigrants | Ghana | 6.9 /100 | #219 | Tragic $51,836 |
| Immigrants | Armenia | 6.6 /100 | #220 | Tragic $51,793 |
| Immigrants | Senegal | 5.8 /100 | #221 | Tragic $51,647 |
| Immigrants | Bangladesh | 5.8 /100 | #222 | Tragic $51,642 |
| Ecuadorians | 5.5 /100 | #223 | Tragic $51,596 |
| Immigrants | Cambodia | 5.5 /100 | #224 | Tragic $51,594 |
| Immigrants | Sudan | 5.0 /100 | #225 | Tragic $51,489 |
| Japanese | 4.9 /100 | #226 | Tragic $51,473 |
| Trinidadians and Tobagonians | 4.8 /100 | #227 | Tragic $51,446 |