Samoan vs Immigrants from Armenia Median Male Earnings
COMPARE
Samoan
Immigrants from Armenia
Median Male Earnings
Median Male Earnings Comparison
Samoans
Immigrants from Armenia
$51,389
MEDIAN MALE EARNINGS
4.6/ 100
METRIC RATING
228th/ 347
METRIC RANK
$51,793
MEDIAN MALE EARNINGS
6.6/ 100
METRIC RATING
220th/ 347
METRIC RANK
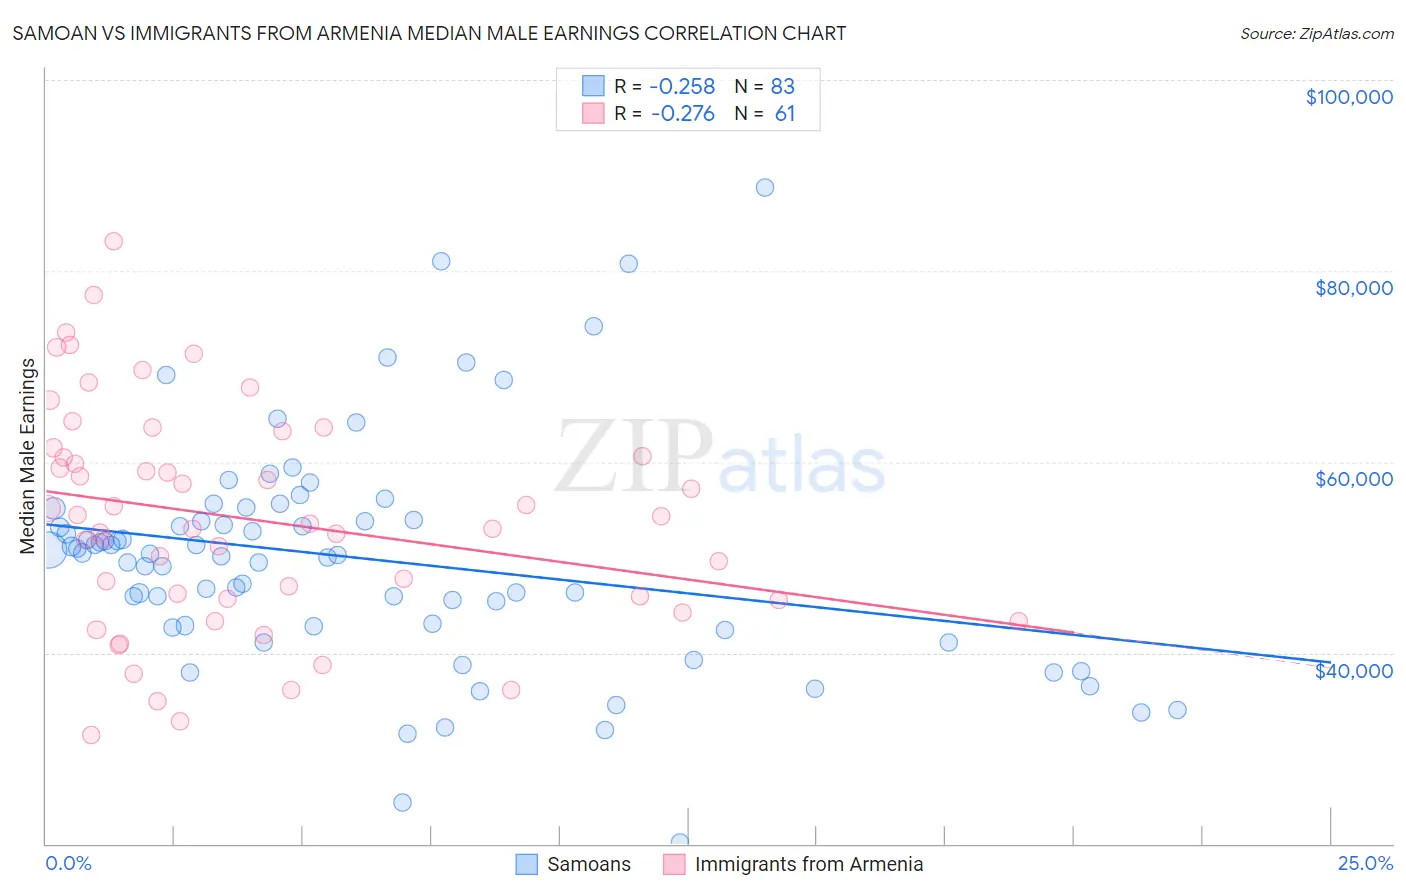
Samoan vs Immigrants from Armenia Median Male Earnings Correlation Chart
The statistical analysis conducted on geographies consisting of 225,157,304 people shows a weak negative correlation between the proportion of Samoans and median male earnings in the United States with a correlation coefficient (R) of -0.258 and weighted average of $51,389. Similarly, the statistical analysis conducted on geographies consisting of 97,713,127 people shows a weak negative correlation between the proportion of Immigrants from Armenia and median male earnings in the United States with a correlation coefficient (R) of -0.276 and weighted average of $51,793, a difference of 0.79%.
Median Male Earnings Correlation Summary
| Measurement | Samoan | Immigrants from Armenia |
| Minimum | $20,179 | $31,379 |
| Maximum | $88,750 | $83,085 |
| Range | $68,571 | $51,706 |
| Mean | $49,891 | $53,967 |
| Median | $50,415 | $53,459 |
| Interquartile 25% (IQ1) | $42,816 | $45,624 |
| Interquartile 75% (IQ3) | $53,887 | $61,019 |
| Interquartile Range (IQR) | $11,071 | $15,395 |
| Standard Deviation (Sample) | $11,942 | $11,610 |
| Standard Deviation (Population) | $11,870 | $11,514 |
Demographics Similar to Samoans and Immigrants from Armenia by Median Male Earnings
In terms of median male earnings, the demographic groups most similar to Samoans are Immigrants from Trinidad and Tobago ($51,376, a difference of 0.030%), Trinidadian and Tobagonian ($51,446, a difference of 0.11%), Japanese ($51,473, a difference of 0.16%), Immigrants from Nigeria ($51,310, a difference of 0.16%), and Immigrants from Sudan ($51,489, a difference of 0.19%). Similarly, the demographic groups most similar to Immigrants from Armenia are Immigrants from Ghana ($51,836, a difference of 0.080%), Immigrants from Senegal ($51,647, a difference of 0.28%), Immigrants from Bangladesh ($51,642, a difference of 0.29%), Immigrants from Panama ($51,962, a difference of 0.33%), and Ecuadorian ($51,596, a difference of 0.38%).
| Demographics | Rating | Rank | Median Male Earnings |
| Immigrants | Nonimmigrants | 9.3 /100 | #214 | Tragic $52,170 |
| Immigrants | Cameroon | 8.9 /100 | #215 | Tragic $52,119 |
| Immigrants | Venezuela | 8.3 /100 | #216 | Tragic $52,041 |
| Nigerians | 8.3 /100 | #217 | Tragic $52,039 |
| Immigrants | Panama | 7.7 /100 | #218 | Tragic $51,962 |
| Immigrants | Ghana | 6.9 /100 | #219 | Tragic $51,836 |
| Immigrants | Armenia | 6.6 /100 | #220 | Tragic $51,793 |
| Immigrants | Senegal | 5.8 /100 | #221 | Tragic $51,647 |
| Immigrants | Bangladesh | 5.8 /100 | #222 | Tragic $51,642 |
| Ecuadorians | 5.5 /100 | #223 | Tragic $51,596 |
| Immigrants | Cambodia | 5.5 /100 | #224 | Tragic $51,594 |
| Immigrants | Sudan | 5.0 /100 | #225 | Tragic $51,489 |
| Japanese | 4.9 /100 | #226 | Tragic $51,473 |
| Trinidadians and Tobagonians | 4.8 /100 | #227 | Tragic $51,446 |
| Samoans | 4.6 /100 | #228 | Tragic $51,389 |
| Immigrants | Trinidad and Tobago | 4.5 /100 | #229 | Tragic $51,376 |
| Immigrants | Nigeria | 4.2 /100 | #230 | Tragic $51,310 |
| Barbadians | 3.9 /100 | #231 | Tragic $51,236 |
| Sudanese | 3.9 /100 | #232 | Tragic $51,216 |
| Aleuts | 3.7 /100 | #233 | Tragic $51,168 |
| Cape Verdeans | 3.5 /100 | #234 | Tragic $51,103 |