Ottawa vs Immigrants from Armenia Median Male Earnings
COMPARE
Ottawa
Immigrants from Armenia
Median Male Earnings
Median Male Earnings Comparison
Ottawa
Immigrants from Armenia
$46,611
MEDIAN MALE EARNINGS
0.0/ 100
METRIC RATING
308th/ 347
METRIC RANK
$51,793
MEDIAN MALE EARNINGS
6.6/ 100
METRIC RATING
220th/ 347
METRIC RANK
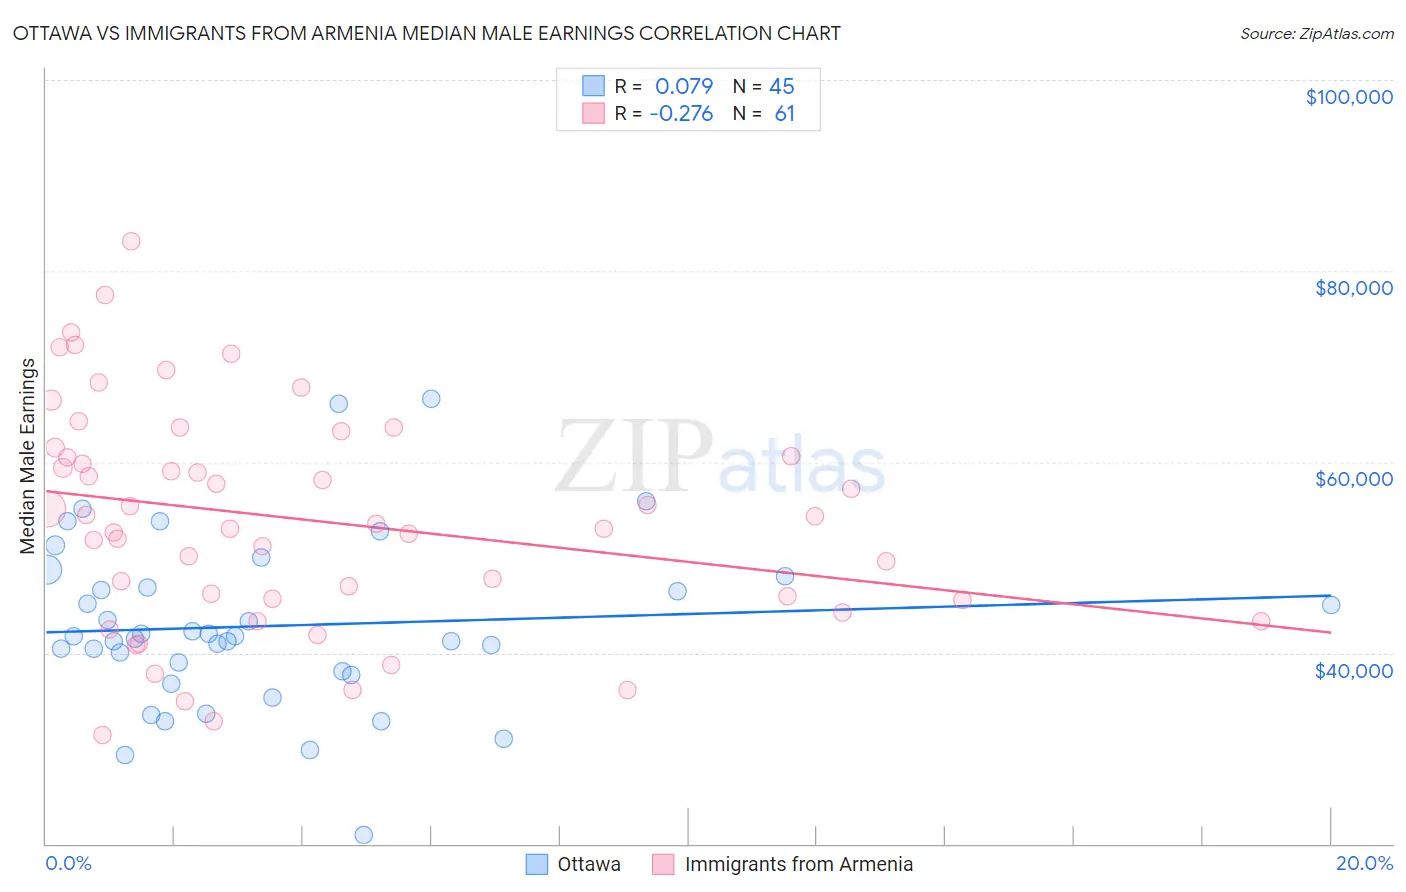
Ottawa vs Immigrants from Armenia Median Male Earnings Correlation Chart
The statistical analysis conducted on geographies consisting of 49,954,818 people shows a slight positive correlation between the proportion of Ottawa and median male earnings in the United States with a correlation coefficient (R) of 0.079 and weighted average of $46,611. Similarly, the statistical analysis conducted on geographies consisting of 97,713,127 people shows a weak negative correlation between the proportion of Immigrants from Armenia and median male earnings in the United States with a correlation coefficient (R) of -0.276 and weighted average of $51,793, a difference of 11.1%.
Median Male Earnings Correlation Summary
| Measurement | Ottawa | Immigrants from Armenia |
| Minimum | $20,938 | $31,379 |
| Maximum | $66,563 | $83,085 |
| Range | $45,625 | $51,706 |
| Mean | $42,823 | $53,967 |
| Median | $41,768 | $53,459 |
| Interquartile 25% (IQ1) | $37,908 | $45,624 |
| Interquartile 75% (IQ3) | $47,441 | $61,019 |
| Interquartile Range (IQR) | $9,533 | $15,395 |
| Standard Deviation (Sample) | $8,970 | $11,610 |
| Standard Deviation (Population) | $8,870 | $11,514 |
Similar Demographics by Median Male Earnings
Demographics Similar to Ottawa by Median Male Earnings
In terms of median male earnings, the demographic groups most similar to Ottawa are Creek ($46,594, a difference of 0.040%), Cuban ($46,580, a difference of 0.070%), Immigrants from Dominican Republic ($46,655, a difference of 0.090%), Dutch West Indian ($46,656, a difference of 0.10%), and Guatemalan ($46,736, a difference of 0.27%).
| Demographics | Rating | Rank | Median Male Earnings |
| Immigrants | Latin America | 0.1 /100 | #301 | Tragic $46,941 |
| Seminole | 0.1 /100 | #302 | Tragic $46,783 |
| Yaqui | 0.1 /100 | #303 | Tragic $46,777 |
| Bangladeshis | 0.1 /100 | #304 | Tragic $46,744 |
| Guatemalans | 0.0 /100 | #305 | Tragic $46,736 |
| Dutch West Indians | 0.0 /100 | #306 | Tragic $46,656 |
| Immigrants | Dominican Republic | 0.0 /100 | #307 | Tragic $46,655 |
| Ottawa | 0.0 /100 | #308 | Tragic $46,611 |
| Creek | 0.0 /100 | #309 | Tragic $46,594 |
| Cubans | 0.0 /100 | #310 | Tragic $46,580 |
| Apache | 0.0 /100 | #311 | Tragic $46,429 |
| Hispanics or Latinos | 0.0 /100 | #312 | Tragic $46,419 |
| Hondurans | 0.0 /100 | #313 | Tragic $46,374 |
| Chippewa | 0.0 /100 | #314 | Tragic $46,368 |
| Immigrants | Guatemala | 0.0 /100 | #315 | Tragic $46,244 |
Demographics Similar to Immigrants from Armenia by Median Male Earnings
In terms of median male earnings, the demographic groups most similar to Immigrants from Armenia are Immigrants from Ghana ($51,836, a difference of 0.080%), Immigrants from Senegal ($51,647, a difference of 0.28%), Immigrants from Bangladesh ($51,642, a difference of 0.29%), Immigrants from Panama ($51,962, a difference of 0.33%), and Ecuadorian ($51,596, a difference of 0.38%).
| Demographics | Rating | Rank | Median Male Earnings |
| Native Hawaiians | 10.5 /100 | #213 | Poor $52,306 |
| Immigrants | Nonimmigrants | 9.3 /100 | #214 | Tragic $52,170 |
| Immigrants | Cameroon | 8.9 /100 | #215 | Tragic $52,119 |
| Immigrants | Venezuela | 8.3 /100 | #216 | Tragic $52,041 |
| Nigerians | 8.3 /100 | #217 | Tragic $52,039 |
| Immigrants | Panama | 7.7 /100 | #218 | Tragic $51,962 |
| Immigrants | Ghana | 6.9 /100 | #219 | Tragic $51,836 |
| Immigrants | Armenia | 6.6 /100 | #220 | Tragic $51,793 |
| Immigrants | Senegal | 5.8 /100 | #221 | Tragic $51,647 |
| Immigrants | Bangladesh | 5.8 /100 | #222 | Tragic $51,642 |
| Ecuadorians | 5.5 /100 | #223 | Tragic $51,596 |
| Immigrants | Cambodia | 5.5 /100 | #224 | Tragic $51,594 |
| Immigrants | Sudan | 5.0 /100 | #225 | Tragic $51,489 |
| Japanese | 4.9 /100 | #226 | Tragic $51,473 |
| Trinidadians and Tobagonians | 4.8 /100 | #227 | Tragic $51,446 |