Seminole vs Swedish Householder Income Under 25 years

COMPARE

Seminole
Race
Ancestry
AfghanAfricanAlaska NativeAlaskan AthabascanAlbanianAleutAlsatianAmericanApacheArabArapahoArgentineanArmenianAssyrian/Chaldean/SyriacAustralianAustrianBahamianBangladeshiBarbadianBasqueBelgianBelizeanBermudanBhutaneseBlackfeetBolivianBrazilianBritishBritish West IndianBulgarianBurmeseCajunCambodianCanadianCape VerdeanCarpatho RusynCelticCentral AmericanCentral American IndianCherokeeCheyenneChickasawChileanChineseChippewaChoctawColombianColvilleComancheCosta RicanCreeCreekCroatianCrowCubanCypriotCzechCzechoslovakianDanishDelawareDominicanDutchDutch West IndianEastern EuropeanEcuadorianEgyptianEnglishEstonianEthiopianEuropeanFijianFilipinoFinnishFrenchFrench American IndianFrench CanadianGermanGerman RussianGhanaianGreekGuamanian/ChamorroGuatemalanGuyaneseHaitianHmongHonduranHopiHoumaHungarianIcelanderIndian (Asian)IndonesianInupiatIranianIraqiIrishIroquoisIsraeliItalianJamaicanJapaneseJordanianKenyanKiowaKoreanLaotianLatvianLebaneseLiberianLithuanianLumbeeLuxembourgerMacedonianMalaysianMalteseMarshalleseMenomineeMexicanMexican American IndianMongolianMoroccanNative HawaiianNavajoNepaleseNew ZealanderNicaraguanNigerianNorthern EuropeanNorwegianOkinawanOsageOttawaPaiutePakistaniPalestinianPanamanianParaguayanPennsylvania GermanPeruvianPimaPolishPortuguesePotawatomiPuebloPuerto RicanPuget Sound SalishRomanianRussianSalvadoranSamoanScandinavianScotch-IrishScottishSeminoleSenegaleseSerbianShoshoneSierra LeoneanSiouxSlavicSlovakSloveneSomaliSouth AfricanSouth AmericanSouth American IndianSoviet UnionSpaniardSpanishSpanish AmericanSpanish American IndianSri LankanSubsaharan AfricanSudaneseSwissSyrianTaiwaneseThaiTlingit-HaidaTohono O'OdhamTonganTrinidadian and TobagonianTsimshianTurkishU.S. Virgin IslanderUgandanUkrainianUruguayanUteVenezuelanVietnameseWelshWest IndianYakamaYaquiYugoslavianYumanYup'ikZimbabwean
Immigration
NonimmigrantsImmigrantsAfghanistanAfricaAlbaniaArgentinaArmeniaAsiaAustraliaAustriaBahamasBangladeshBarbadosBelarusBelgiumBelizeBoliviaBosnia and HerzegovinaBrazilBulgariaBurma/MyanmarCabo VerdeCambodiaCameroonCanadaCaribbeanCentral AmericaChileChinaColombiaCongoCosta RicaCroatiaCubaCzechoslovakiaDenmarkDominicaDominican RepublicEastern AfricaEastern AsiaEastern EuropeEcuadorEgyptEl SalvadorEnglandEritreaEthiopiaEuropeFijiFranceGermanyGhanaGreeceGrenadaGuatemalaGuyanaHaitiHondurasHong KongHungaryIndiaIndonesiaIranIraqIrelandIsraelItalyJamaicaJapanJordanKazakhstanKenyaKoreaKuwaitLaosLatin AmericaLatviaLebanonLiberiaLithuaniaMalaysiaMexicoMicronesiaMiddle AfricaMoldovaMoroccoNepalNetherlandsNicaraguaNigeriaNorth AmericaNorth MacedoniaNorthern AfricaNorthern EuropeNorwayOceaniaPakistanPanamaPeruPhilippinesPolandPortugalRomaniaRussiaSaudi ArabiaScotlandSenegalSerbiaSierra LeoneSingaporeSomaliaSouth AfricaSouth AmericaSouth Central AsiaSouth Eastern AsiaSouthern EuropeSpainSri LankaSt. Vincent and the GrenadinesSudanSwedenSwitzerlandSyriaTaiwanThailandTrinidad and TobagoTurkeyUgandaUkraineUruguayUzbekistanVenezuelaVietnamWest IndiesWestern AfricaWestern AsiaWestern EuropeYemenZaireZimbabweAzores
Swedish
Race
Ancestry
AfghanAfricanAlaska NativeAlaskan AthabascanAlbanianAleutAlsatianAmericanApacheArabArapahoArgentineanArmenianAssyrian/Chaldean/SyriacAustralianAustrianBahamianBangladeshiBarbadianBasqueBelgianBelizeanBermudanBhutaneseBlackfeetBolivianBrazilianBritishBritish West IndianBulgarianBurmeseCajunCambodianCanadianCape VerdeanCarpatho RusynCelticCentral AmericanCentral American IndianCherokeeCheyenneChickasawChileanChineseChippewaChoctawColombianColvilleComancheCosta RicanCreeCreekCroatianCrowCubanCypriotCzechCzechoslovakianDanishDelawareDominicanDutchDutch West IndianEastern EuropeanEcuadorianEgyptianEnglishEstonianEthiopianEuropeanFijianFilipinoFinnishFrenchFrench American IndianFrench CanadianGermanGerman RussianGhanaianGreekGuamanian/ChamorroGuatemalanGuyaneseHaitianHmongHonduranHopiHoumaHungarianIcelanderIndian (Asian)IndonesianInupiatIranianIraqiIrishIroquoisIsraeliItalianJamaicanJapaneseJordanianKenyanKiowaKoreanLaotianLatvianLebaneseLiberianLithuanianLumbeeLuxembourgerMacedonianMalaysianMalteseMarshalleseMenomineeMexicanMexican American IndianMongolianMoroccanNative HawaiianNavajoNepaleseNew ZealanderNicaraguanNigerianNorthern EuropeanNorwegianOkinawanOsageOttawaPaiutePakistaniPalestinianPanamanianParaguayanPennsylvania GermanPeruvianPimaPolishPortuguesePotawatomiPuebloPuerto RicanPuget Sound SalishRomanianRussianSalvadoranSamoanScandinavianScotch-IrishScottishSenegaleseSerbianShoshoneSierra LeoneanSiouxSlavicSlovakSloveneSomaliSouth AfricanSouth AmericanSouth American IndianSoviet UnionSpaniardSpanishSpanish AmericanSpanish American IndianSri LankanSubsaharan AfricanSudaneseSwedishSwissSyrianTaiwaneseThaiTlingit-HaidaTohono O'OdhamTonganTrinidadian and TobagonianTsimshianTurkishU.S. Virgin IslanderUgandanUkrainianUruguayanUteVenezuelanVietnameseWelshWest IndianYakamaYaquiYugoslavianYumanYup'ikZimbabwean
Immigration
NonimmigrantsImmigrantsAfghanistanAfricaAlbaniaArgentinaArmeniaAsiaAustraliaAustriaBahamasBangladeshBarbadosBelarusBelgiumBelizeBoliviaBosnia and HerzegovinaBrazilBulgariaBurma/MyanmarCabo VerdeCambodiaCameroonCanadaCaribbeanCentral AmericaChileChinaColombiaCongoCosta RicaCroatiaCubaCzechoslovakiaDenmarkDominicaDominican RepublicEastern AfricaEastern AsiaEastern EuropeEcuadorEgyptEl SalvadorEnglandEritreaEthiopiaEuropeFijiFranceGermanyGhanaGreeceGrenadaGuatemalaGuyanaHaitiHondurasHong KongHungaryIndiaIndonesiaIranIraqIrelandIsraelItalyJamaicaJapanJordanKazakhstanKenyaKoreaKuwaitLaosLatin AmericaLatviaLebanonLiberiaLithuaniaMalaysiaMexicoMicronesiaMiddle AfricaMoldovaMoroccoNepalNetherlandsNicaraguaNigeriaNorth AmericaNorth MacedoniaNorthern AfricaNorthern EuropeNorwayOceaniaPakistanPanamaPeruPhilippinesPolandPortugalRomaniaRussiaSaudi ArabiaScotlandSenegalSerbiaSierra LeoneSingaporeSomaliaSouth AfricaSouth AmericaSouth Central AsiaSouth Eastern AsiaSouthern EuropeSpainSri LankaSt. Vincent and the GrenadinesSudanSwedenSwitzerlandSyriaTaiwanThailandTrinidad and TobagoTurkeyUgandaUkraineUruguayUzbekistanVenezuelaVietnamWest IndiesWestern AfricaWestern AsiaWestern EuropeYemenZaireZimbabweAzores
Householder Income Under 25 years
Income
Poverty
Unemployment
Labor Participation
Family Structure
Vehicle Availability
Education Level
Disability

Householder Income Under 25 years Comparison

Seminole

Swedes

Tragic
Excellent
$45,649
HOUSEHOLDER INCOME UNDER 25 YEARS
0.0/ 100
METRIC RATING
329th/ 347
METRIC RANK
$52,986
HOUSEHOLDER INCOME UNDER 25 YEARS
87.5/ 100
METRIC RATING
143rd/ 347
METRIC RANK

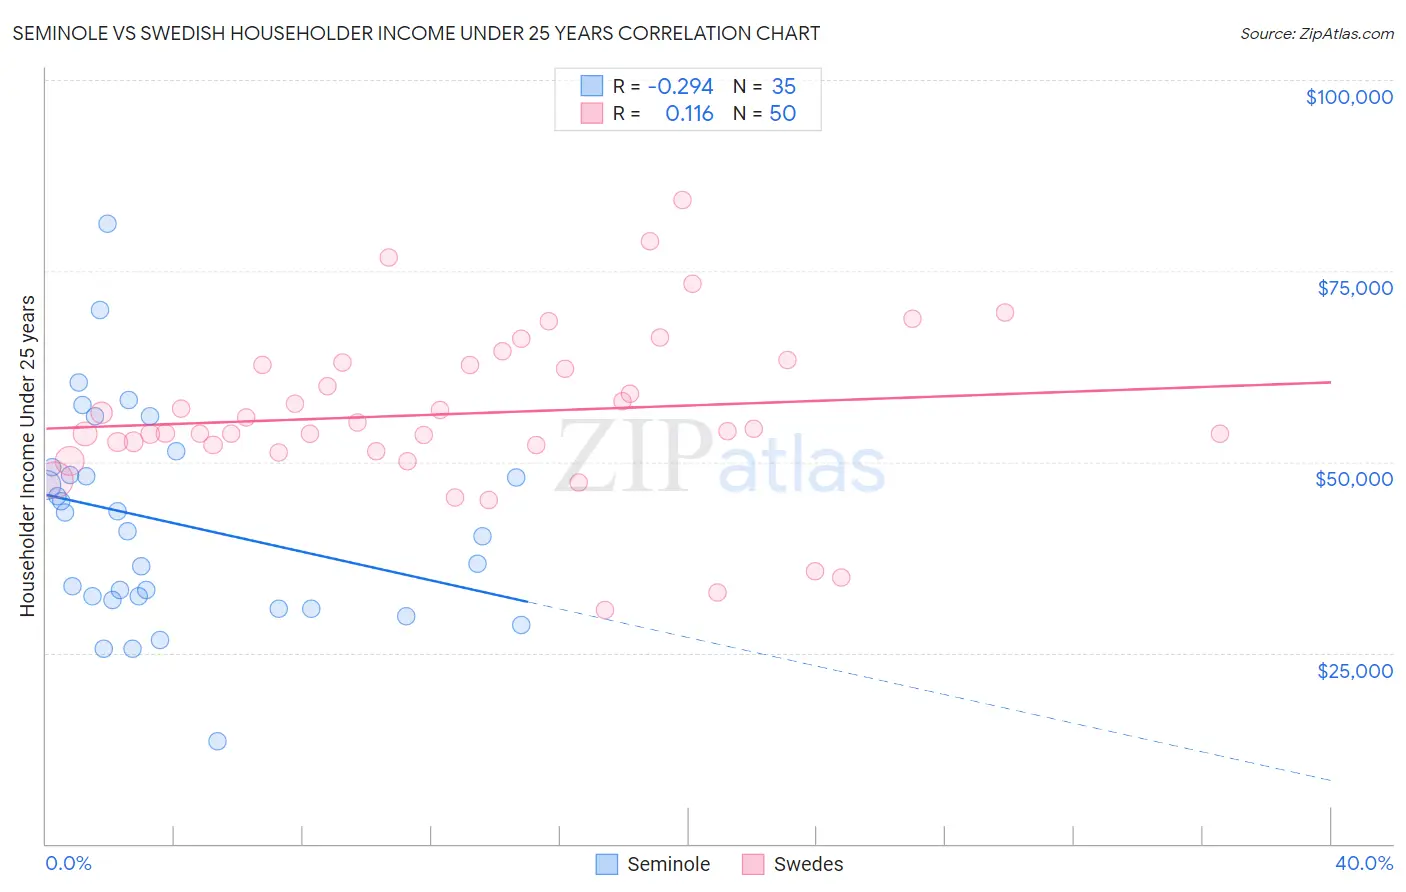
Seminole vs Swedish Householder Income Under 25 years Correlation Chart

The statistical analysis conducted on geographies consisting of 111,016,560 people shows a weak negative correlation between the proportion of Seminole and household income with householder under the age of 25 in the United States with a correlation coefficient (R) of -0.294 and weighted average of $45,649. Similarly, the statistical analysis conducted on geographies consisting of 422,891,046 people shows a poor positive correlation between the proportion of Swedes and household income with householder under the age of 25 in the United States with a correlation coefficient (R) of 0.116 and weighted average of $52,986, a difference of 16.1%.
Seminole vs Swedish Householder Income Under 25 years

Householder Income Under 25 years Correlation Summary

MeasurementSeminoleSwedish
Minimum$13,438$30,603
Maximum$81,161$84,275
Range$67,723$53,673
Mean$42,022$56,322
Median$40,978$54,225
Interquartile 25% (IQ1)$31,954$52,194
Interquartile 75% (IQ3)$49,288$62,766
Interquartile Range (IQR)$17,334$10,572
Standard Deviation (Sample)$13,916$10,808
Standard Deviation (Population)$13,715$10,700

Similar Demographics by Householder Income Under 25 years

Demographics Similar to Seminole by Householder Income Under 25 years

In terms of householder income under 25 years, the demographic groups most similar to Seminole are German Russian ($45,673, a difference of 0.050%), Indonesian ($45,566, a difference of 0.18%), Bahamian ($45,743, a difference of 0.21%), Osage ($45,764, a difference of 0.25%), and Immigrants from Zaire ($45,529, a difference of 0.26%).
DemographicsRating | RankHouseholder Income Under 25 years
Sioux
0.0
/100
|
#322
Tragic
$46,417
Immigrants | Saudi Arabia
0.0
/100
|
#323
Tragic
$46,187
Dutch West Indians
0.0
/100
|
#324
Tragic
$45,816
Immigrants | Bahamas
0.0
/100
|
#325
Tragic
$45,793
Osage
0.0
/100
|
#326
Tragic
$45,764
Bahamians
0.0
/100
|
#327
Tragic
$45,743
German Russians
0.0
/100
|
#328
Tragic
$45,673
Seminole
0.0
/100
|
#329
Tragic
$45,649
Indonesians
0.0
/100
|
#330
Tragic
$45,566
Immigrants | Zaire
0.0
/100
|
#331
Tragic
$45,529
Choctaw
0.0
/100
|
#332
Tragic
$45,450
Creek
0.0
/100
|
#333
Tragic
$45,371
Cajuns
0.0
/100
|
#334
Tragic
$45,338
Cheyenne
0.0
/100
|
#335
Tragic
$45,275
Tohono O'odham
0.0
/100
|
#336
Tragic
$45,248

Demographics Similar to Swedes by Householder Income Under 25 years

In terms of householder income under 25 years, the demographic groups most similar to Swedes are Immigrants from Armenia ($52,986, a difference of 0.0%), South American Indian ($52,979, a difference of 0.010%), Immigrants from Western Europe ($52,957, a difference of 0.050%), Danish ($53,041, a difference of 0.10%), and Hawaiian ($53,078, a difference of 0.17%).
DemographicsRating | RankHouseholder Income Under 25 years
Armenians
91.8
/100
|
#136
Exceptional
$53,179
Immigrants | Barbados
91.5
/100
|
#137
Exceptional
$53,163
Norwegians
90.8
/100
|
#138
Exceptional
$53,127
Costa Ricans
90.4
/100
|
#139
Exceptional
$53,106
Hawaiians
89.8
/100
|
#140
Excellent
$53,078
Danes
88.9
/100
|
#141
Excellent
$53,041
Immigrants | Armenia
87.5
/100
|
#142
Excellent
$52,986
Swedes
87.5
/100
|
#143
Excellent
$52,986
South American Indians
87.3
/100
|
#144
Excellent
$52,979
Immigrants | Western Europe
86.7
/100
|
#145
Excellent
$52,957
Immigrants | Hungary
81.6
/100
|
#146
Excellent
$52,798
Latvians
81.0
/100
|
#147
Excellent
$52,783
French Canadians
76.5
/100
|
#148
Good
$52,672
Scandinavians
75.7
/100
|
#149
Good
$52,654
Immigrants | Costa Rica
75.2
/100
|
#150
Good
$52,643