White/Caucasian vs Swedish Currently Married
COMPARE
White/Caucasian
Swedish
Currently Married
Currently Married Comparison
Whites/Caucasians
Swedes
48.6%
CURRENTLY MARRIED
99.0/ 100
METRIC RATING
51st/ 347
METRIC RANK
50.0%
CURRENTLY MARRIED
100.0/ 100
METRIC RATING
8th/ 347
METRIC RANK
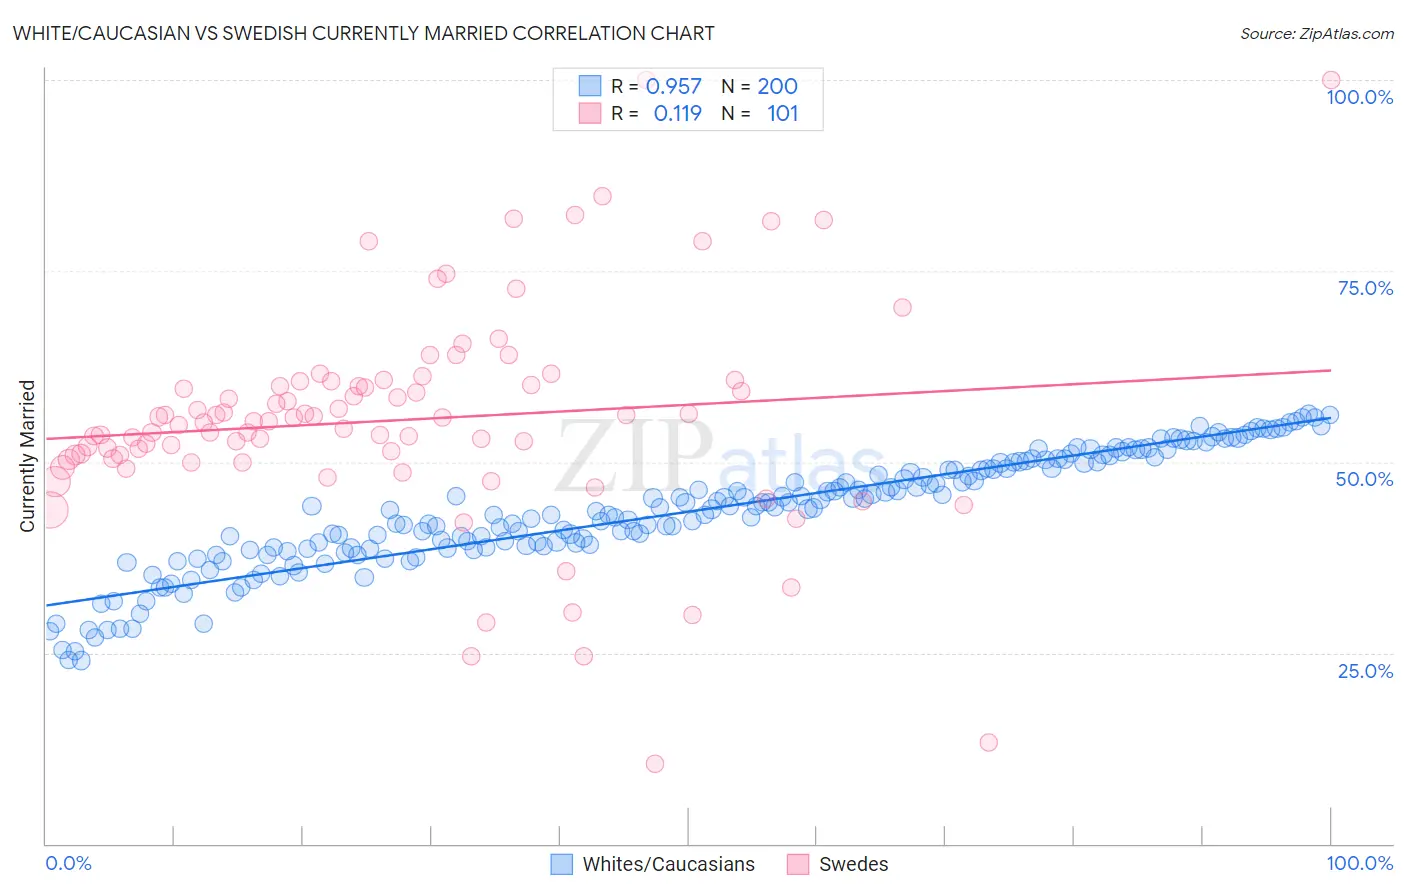
White/Caucasian vs Swedish Currently Married Correlation Chart
The statistical analysis conducted on geographies consisting of 585,061,010 people shows a perfect positive correlation between the proportion of Whites/Caucasians and percentage of population currently married in the United States with a correlation coefficient (R) of 0.957 and weighted average of 48.6%. Similarly, the statistical analysis conducted on geographies consisting of 539,138,052 people shows a poor positive correlation between the proportion of Swedes and percentage of population currently married in the United States with a correlation coefficient (R) of 0.119 and weighted average of 50.0%, a difference of 2.8%.
Currently Married Correlation Summary
| Measurement | White/Caucasian | Swedish |
| Minimum | 24.0% | 10.5% |
| Maximum | 56.4% | 100.0% |
| Range | 32.4% | 89.5% |
| Mean | 43.5% | 55.5% |
| Median | 44.0% | 55.3% |
| Interquartile 25% (IQ1) | 38.8% | 50.4% |
| Interquartile 75% (IQ3) | 49.5% | 60.2% |
| Interquartile Range (IQR) | 10.7% | 9.9% |
| Standard Deviation (Sample) | 7.4% | 14.4% |
| Standard Deviation (Population) | 7.4% | 14.4% |
Similar Demographics by Currently Married
Demographics Similar to Whites/Caucasians by Currently Married
In terms of currently married, the demographic groups most similar to Whites/Caucasians are Iranian (48.6%, a difference of 0.010%), Bhutanese (48.6%, a difference of 0.070%), Russian (48.6%, a difference of 0.090%), Austrian (48.7%, a difference of 0.20%), and Immigrants from Austria (48.5%, a difference of 0.20%).
| Demographics | Rating | Rank | Currently Married |
| Immigrants | North America | 99.3 /100 | #44 | Exceptional 48.7% |
| Belgians | 99.3 /100 | #45 | Exceptional 48.7% |
| Immigrants | Iran | 99.2 /100 | #46 | Exceptional 48.7% |
| Northern Europeans | 99.2 /100 | #47 | Exceptional 48.7% |
| Austrians | 99.2 /100 | #48 | Exceptional 48.7% |
| Bhutanese | 99.1 /100 | #49 | Exceptional 48.6% |
| Iranians | 99.0 /100 | #50 | Exceptional 48.6% |
| Whites/Caucasians | 99.0 /100 | #51 | Exceptional 48.6% |
| Russians | 98.9 /100 | #52 | Exceptional 48.6% |
| Immigrants | Austria | 98.8 /100 | #53 | Exceptional 48.5% |
| Immigrants | Moldova | 98.7 /100 | #54 | Exceptional 48.5% |
| Immigrants | North Macedonia | 98.7 /100 | #55 | Exceptional 48.5% |
| Latvians | 98.7 /100 | #56 | Exceptional 48.5% |
| Immigrants | Netherlands | 98.6 /100 | #57 | Exceptional 48.5% |
| French | 98.6 /100 | #58 | Exceptional 48.4% |
Demographics Similar to Swedes by Currently Married
In terms of currently married, the demographic groups most similar to Swedes are Immigrants from South Central Asia (50.0%, a difference of 0.13%), Czech (49.9%, a difference of 0.19%), Filipino (49.7%, a difference of 0.45%), English (49.7%, a difference of 0.46%), and Swiss (49.7%, a difference of 0.46%).
| Demographics | Rating | Rank | Currently Married |
| Immigrants | India | 100.0 /100 | #1 | Exceptional 51.8% |
| Thais | 100.0 /100 | #2 | Exceptional 50.9% |
| Assyrians/Chaldeans/Syriacs | 100.0 /100 | #3 | Exceptional 50.8% |
| Immigrants | Taiwan | 100.0 /100 | #4 | Exceptional 50.7% |
| Danes | 100.0 /100 | #5 | Exceptional 50.5% |
| Norwegians | 100.0 /100 | #6 | Exceptional 50.2% |
| Immigrants | South Central Asia | 100.0 /100 | #7 | Exceptional 50.0% |
| Swedes | 100.0 /100 | #8 | Exceptional 50.0% |
| Czechs | 99.9 /100 | #9 | Exceptional 49.9% |
| Filipinos | 99.9 /100 | #10 | Exceptional 49.7% |
| English | 99.9 /100 | #11 | Exceptional 49.7% |
| Swiss | 99.9 /100 | #12 | Exceptional 49.7% |
| Dutch | 99.9 /100 | #13 | Exceptional 49.6% |
| Germans | 99.9 /100 | #14 | Exceptional 49.6% |
| Pennsylvania Germans | 99.9 /100 | #15 | Exceptional 49.6% |