White/Caucasian vs Samoan Professional Degree
COMPARE
White/Caucasian
Samoan
Professional Degree
Professional Degree Comparison
Whites/Caucasians
Samoans
4.1%
PROFESSIONAL DEGREE
11.2/ 100
METRIC RATING
212th/ 347
METRIC RANK
3.3%
PROFESSIONAL DEGREE
0.1/ 100
METRIC RATING
307th/ 347
METRIC RANK
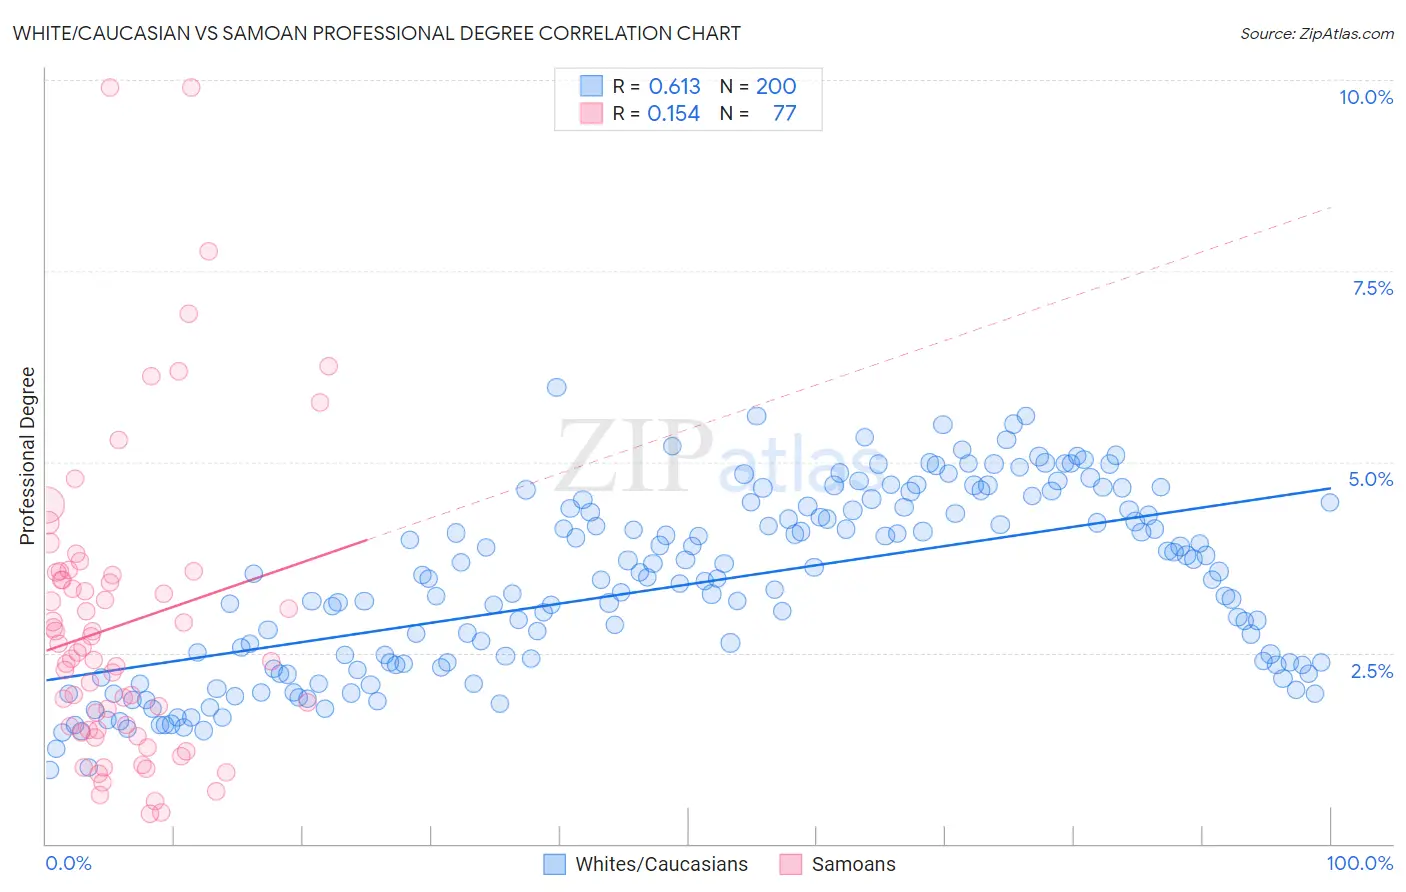
White/Caucasian vs Samoan Professional Degree Correlation Chart
The statistical analysis conducted on geographies consisting of 572,420,788 people shows a significant positive correlation between the proportion of Whites/Caucasians and percentage of population with at least professional degree education in the United States with a correlation coefficient (R) of 0.613 and weighted average of 4.1%. Similarly, the statistical analysis conducted on geographies consisting of 224,756,232 people shows a poor positive correlation between the proportion of Samoans and percentage of population with at least professional degree education in the United States with a correlation coefficient (R) of 0.154 and weighted average of 3.3%, a difference of 22.5%.
Professional Degree Correlation Summary
| Measurement | White/Caucasian | Samoan |
| Minimum | 0.97% | 0.40% |
| Maximum | 6.0% | 9.9% |
| Range | 5.0% | 9.5% |
| Mean | 3.4% | 2.9% |
| Median | 3.5% | 2.5% |
| Interquartile 25% (IQ1) | 2.3% | 1.5% |
| Interquartile 75% (IQ3) | 4.4% | 3.5% |
| Interquartile Range (IQR) | 2.0% | 2.1% |
| Standard Deviation (Sample) | 1.2% | 1.9% |
| Standard Deviation (Population) | 1.2% | 1.9% |
Similar Demographics by Professional Degree
Demographics Similar to Whites/Caucasians by Professional Degree
In terms of professional degree, the demographic groups most similar to Whites/Caucasians are German (4.1%, a difference of 0.18%), Korean (4.1%, a difference of 0.18%), Immigrants from Nigeria (4.1%, a difference of 0.21%), Immigrants from Ghana (4.1%, a difference of 0.23%), and Portuguese (4.1%, a difference of 0.28%).
| Demographics | Rating | Rank | Professional Degree |
| Somalis | 14.8 /100 | #205 | Poor 4.1% |
| Yugoslavians | 13.4 /100 | #206 | Poor 4.1% |
| Sub-Saharan Africans | 12.8 /100 | #207 | Poor 4.1% |
| Immigrants | Somalia | 12.5 /100 | #208 | Poor 4.1% |
| Immigrants | Panama | 12.3 /100 | #209 | Poor 4.1% |
| Immigrants | Nigeria | 11.7 /100 | #210 | Poor 4.1% |
| Germans | 11.6 /100 | #211 | Poor 4.1% |
| Whites/Caucasians | 11.2 /100 | #212 | Poor 4.1% |
| Koreans | 10.7 /100 | #213 | Poor 4.1% |
| Immigrants | Ghana | 10.6 /100 | #214 | Poor 4.1% |
| Portuguese | 10.5 /100 | #215 | Poor 4.1% |
| West Indians | 9.8 /100 | #216 | Tragic 4.1% |
| Immigrants | Vietnam | 9.4 /100 | #217 | Tragic 4.0% |
| Dutch | 9.0 /100 | #218 | Tragic 4.0% |
| Immigrants | South Eastern Asia | 8.9 /100 | #219 | Tragic 4.0% |
Demographics Similar to Samoans by Professional Degree
In terms of professional degree, the demographic groups most similar to Samoans are Shoshone (3.3%, a difference of 0.50%), Pima (3.3%, a difference of 0.51%), Immigrants from Latin America (3.3%, a difference of 0.83%), Cherokee (3.3%, a difference of 0.99%), and Cape Verdean (3.4%, a difference of 1.1%).
| Demographics | Rating | Rank | Professional Degree |
| Blacks/African Americans | 0.2 /100 | #300 | Tragic 3.4% |
| Immigrants | Dominican Republic | 0.2 /100 | #301 | Tragic 3.4% |
| Malaysians | 0.2 /100 | #302 | Tragic 3.4% |
| Immigrants | Haiti | 0.2 /100 | #303 | Tragic 3.4% |
| Cajuns | 0.2 /100 | #304 | Tragic 3.4% |
| Chickasaw | 0.1 /100 | #305 | Tragic 3.4% |
| Cape Verdeans | 0.1 /100 | #306 | Tragic 3.4% |
| Samoans | 0.1 /100 | #307 | Tragic 3.3% |
| Shoshone | 0.1 /100 | #308 | Tragic 3.3% |
| Pima | 0.1 /100 | #309 | Tragic 3.3% |
| Immigrants | Latin America | 0.1 /100 | #310 | Tragic 3.3% |
| Cherokee | 0.1 /100 | #311 | Tragic 3.3% |
| Sioux | 0.1 /100 | #312 | Tragic 3.3% |
| Yuman | 0.1 /100 | #313 | Tragic 3.3% |
| Mexican American Indians | 0.1 /100 | #314 | Tragic 3.3% |