White/Caucasian vs Samoan No Schooling Completed
COMPARE
White/Caucasian
Samoan
No Schooling Completed
No Schooling Completed Comparison
Whites/Caucasians
Samoans
1.6%
NO SCHOOLING COMPLETED
99.9/ 100
METRIC RATING
49th/ 347
METRIC RANK
2.3%
NO SCHOOLING COMPLETED
8.2/ 100
METRIC RATING
214th/ 347
METRIC RANK
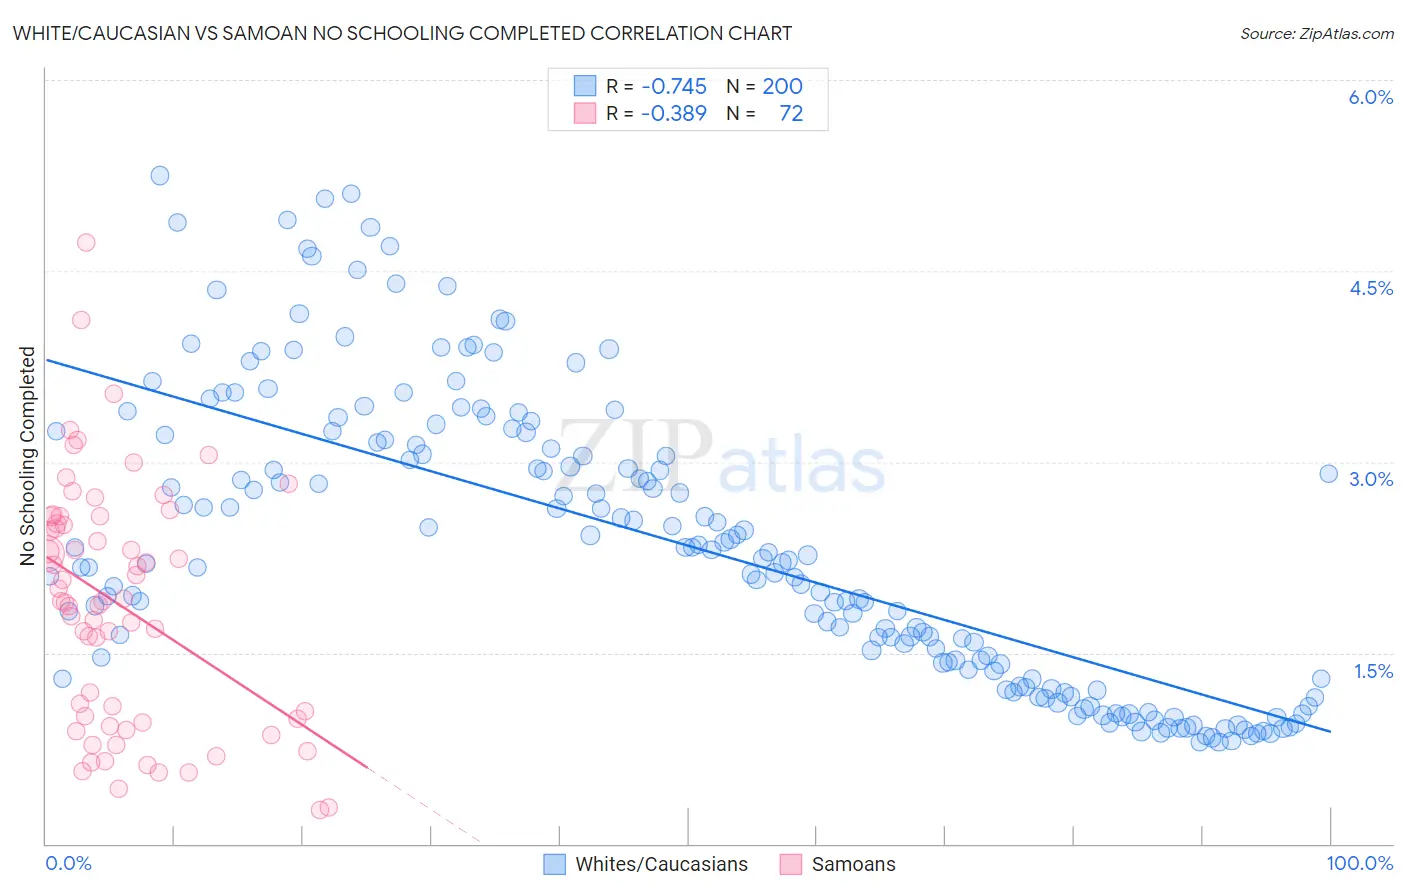
White/Caucasian vs Samoan No Schooling Completed Correlation Chart
The statistical analysis conducted on geographies consisting of 562,623,303 people shows a strong negative correlation between the proportion of Whites/Caucasians and percentage of population with no schooling in the United States with a correlation coefficient (R) of -0.745 and weighted average of 1.6%. Similarly, the statistical analysis conducted on geographies consisting of 223,861,902 people shows a mild negative correlation between the proportion of Samoans and percentage of population with no schooling in the United States with a correlation coefficient (R) of -0.389 and weighted average of 2.3%, a difference of 38.7%.
No Schooling Completed Correlation Summary
| Measurement | White/Caucasian | Samoan |
| Minimum | 0.80% | 0.26% |
| Maximum | 5.2% | 4.7% |
| Range | 4.5% | 4.5% |
| Mean | 2.3% | 1.9% |
| Median | 2.2% | 1.9% |
| Interquartile 25% (IQ1) | 1.3% | 0.97% |
| Interquartile 75% (IQ3) | 3.2% | 2.5% |
| Interquartile Range (IQR) | 1.9% | 1.6% |
| Standard Deviation (Sample) | 1.1% | 0.95% |
| Standard Deviation (Population) | 1.1% | 0.95% |
Similar Demographics by No Schooling Completed
Demographics Similar to Whites/Caucasians by No Schooling Completed
In terms of no schooling completed, the demographic groups most similar to Whites/Caucasians are Immigrants from Scotland (1.6%, a difference of 0.060%), Celtic (1.6%, a difference of 0.13%), Ottawa (1.6%, a difference of 0.31%), Chippewa (1.6%, a difference of 0.34%), and Immigrants from Canada (1.6%, a difference of 0.41%).
| Demographics | Rating | Rank | No Schooling Completed |
| Bulgarians | 99.9 /100 | #42 | Exceptional 1.6% |
| Australians | 99.9 /100 | #43 | Exceptional 1.6% |
| Estonians | 99.9 /100 | #44 | Exceptional 1.6% |
| Czechoslovakians | 99.9 /100 | #45 | Exceptional 1.6% |
| Maltese | 99.9 /100 | #46 | Exceptional 1.6% |
| Ottawa | 99.9 /100 | #47 | Exceptional 1.6% |
| Immigrants | Scotland | 99.9 /100 | #48 | Exceptional 1.6% |
| Whites/Caucasians | 99.9 /100 | #49 | Exceptional 1.6% |
| Celtics | 99.9 /100 | #50 | Exceptional 1.6% |
| Chippewa | 99.8 /100 | #51 | Exceptional 1.6% |
| Immigrants | Canada | 99.8 /100 | #52 | Exceptional 1.6% |
| Creek | 99.8 /100 | #53 | Exceptional 1.6% |
| Crow | 99.8 /100 | #54 | Exceptional 1.6% |
| Greeks | 99.8 /100 | #55 | Exceptional 1.6% |
| Immigrants | North America | 99.8 /100 | #56 | Exceptional 1.6% |
Demographics Similar to Samoans by No Schooling Completed
In terms of no schooling completed, the demographic groups most similar to Samoans are Ute (2.3%, a difference of 0.040%), Immigrants from Morocco (2.3%, a difference of 0.23%), Immigrants from Panama (2.3%, a difference of 0.24%), Immigrants from Zaire (2.3%, a difference of 0.43%), and Tongan (2.3%, a difference of 0.63%).
| Demographics | Rating | Rank | No Schooling Completed |
| South American Indians | 11.0 /100 | #207 | Poor 2.2% |
| Uruguayans | 11.0 /100 | #208 | Poor 2.2% |
| Immigrants | Oceania | 10.2 /100 | #209 | Poor 2.2% |
| Natives/Alaskans | 10.0 /100 | #210 | Tragic 2.2% |
| Immigrants | Panama | 8.8 /100 | #211 | Tragic 2.3% |
| Immigrants | Morocco | 8.7 /100 | #212 | Tragic 2.3% |
| Ute | 8.2 /100 | #213 | Tragic 2.3% |
| Samoans | 8.2 /100 | #214 | Tragic 2.3% |
| Immigrants | Zaire | 7.2 /100 | #215 | Tragic 2.3% |
| Tongans | 6.8 /100 | #216 | Tragic 2.3% |
| Immigrants | Syria | 6.6 /100 | #217 | Tragic 2.3% |
| Immigrants | Nepal | 6.4 /100 | #218 | Tragic 2.3% |
| Senegalese | 5.6 /100 | #219 | Tragic 2.3% |
| Immigrants | Costa Rica | 5.1 /100 | #220 | Tragic 2.3% |
| Immigrants | Sudan | 5.0 /100 | #221 | Tragic 2.3% |