Immigrants from Singapore vs Paraguayan Householder Income Under 25 years
COMPARE
Immigrants from Singapore
Paraguayan
Householder Income Under 25 years
Householder Income Under 25 years Comparison
Immigrants from Singapore
Paraguayans
$56,835
HOUSEHOLDER INCOME UNDER 25 YEARS
100.0/ 100
METRIC RATING
24th/ 347
METRIC RANK
$55,614
HOUSEHOLDER INCOME UNDER 25 YEARS
100.0/ 100
METRIC RATING
44th/ 347
METRIC RANK
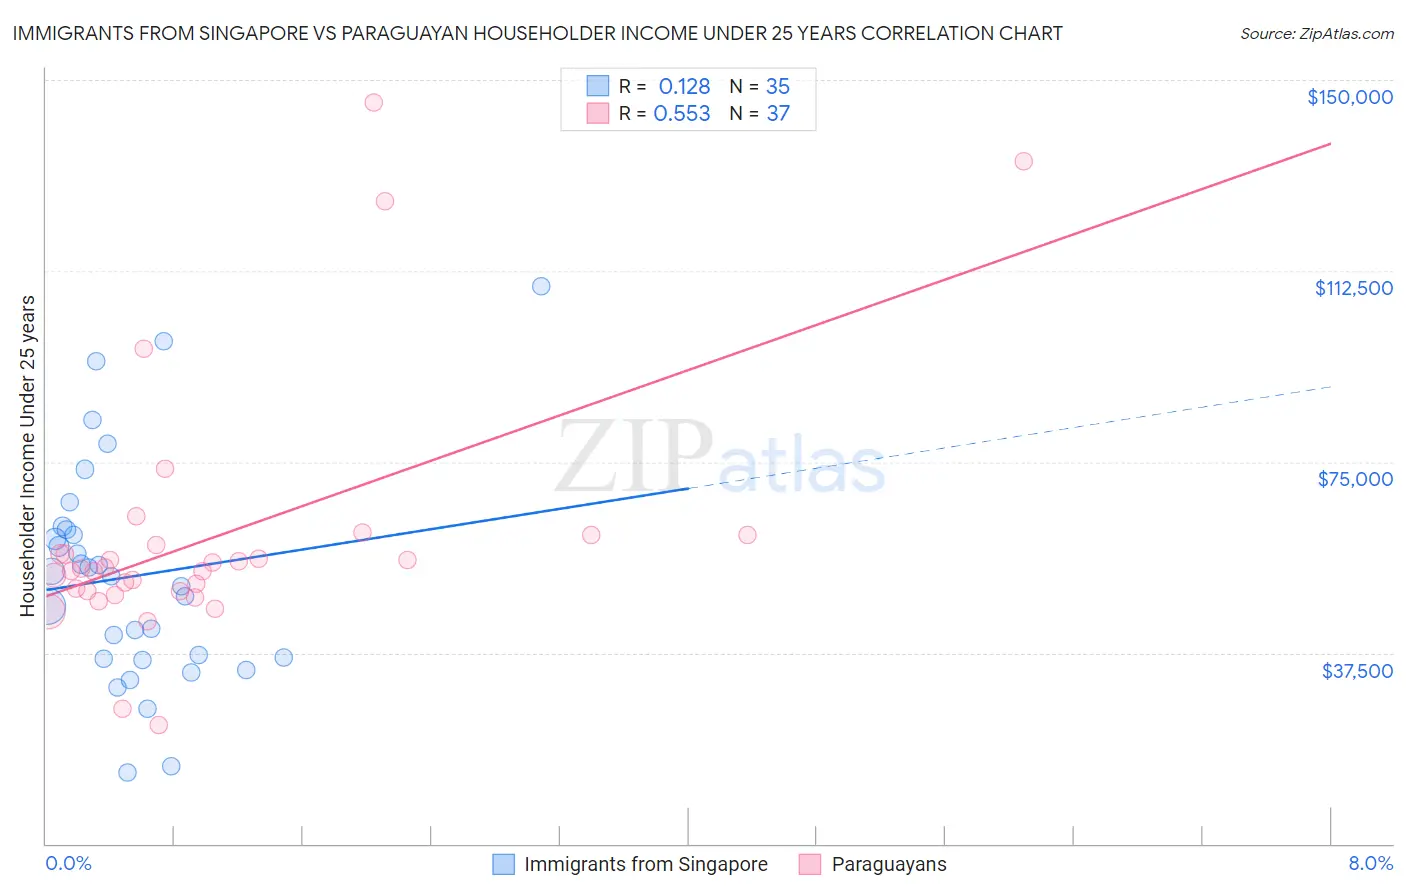
Immigrants from Singapore vs Paraguayan Householder Income Under 25 years Correlation Chart
The statistical analysis conducted on geographies consisting of 123,473,430 people shows a poor positive correlation between the proportion of Immigrants from Singapore and household income with householder under the age of 25 in the United States with a correlation coefficient (R) of 0.128 and weighted average of $56,835. Similarly, the statistical analysis conducted on geographies consisting of 88,924,769 people shows a substantial positive correlation between the proportion of Paraguayans and household income with householder under the age of 25 in the United States with a correlation coefficient (R) of 0.553 and weighted average of $55,614, a difference of 2.2%.
Householder Income Under 25 years Correlation Summary
| Measurement | Immigrants from Singapore | Paraguayan |
| Minimum | $14,087 | $23,438 |
| Maximum | $109,471 | $145,536 |
| Range | $95,384 | $122,098 |
| Mean | $52,518 | $60,245 |
| Median | $52,500 | $54,059 |
| Interquartile 25% (IQ1) | $36,250 | $49,601 |
| Interquartile 75% (IQ3) | $61,737 | $59,594 |
| Interquartile Range (IQR) | $25,487 | $9,992 |
| Standard Deviation (Sample) | $21,943 | $25,388 |
| Standard Deviation (Population) | $21,627 | $25,042 |
Demographics Similar to Immigrants from Singapore and Paraguayans by Householder Income Under 25 years
In terms of householder income under 25 years, the demographic groups most similar to Immigrants from Singapore are Immigrants from Pakistan ($56,789, a difference of 0.080%), Immigrants from Australia ($56,660, a difference of 0.31%), Immigrants from North Macedonia ($56,503, a difference of 0.59%), Immigrants from Peru ($56,384, a difference of 0.80%), and Immigrants from Asia ($56,379, a difference of 0.81%). Similarly, the demographic groups most similar to Paraguayans are Immigrants from Korea ($55,716, a difference of 0.18%), Immigrants from South Eastern Asia ($55,714, a difference of 0.18%), Immigrants from Greece ($55,727, a difference of 0.20%), Immigrants from Guyana ($55,726, a difference of 0.20%), and Immigrants from Belarus ($55,743, a difference of 0.23%).
| Demographics | Rating | Rank | Householder Income Under 25 years |
| Immigrants | Singapore | 100.0 /100 | #24 | Exceptional $56,835 |
| Immigrants | Pakistan | 100.0 /100 | #25 | Exceptional $56,789 |
| Immigrants | Australia | 100.0 /100 | #26 | Exceptional $56,660 |
| Immigrants | North Macedonia | 100.0 /100 | #27 | Exceptional $56,503 |
| Immigrants | Peru | 100.0 /100 | #28 | Exceptional $56,384 |
| Immigrants | Asia | 100.0 /100 | #29 | Exceptional $56,379 |
| Immigrants | Moldova | 100.0 /100 | #30 | Exceptional $56,168 |
| Vietnamese | 100.0 /100 | #31 | Exceptional $56,127 |
| Peruvians | 100.0 /100 | #32 | Exceptional $56,052 |
| Inupiat | 100.0 /100 | #33 | Exceptional $55,935 |
| Immigrants | Japan | 100.0 /100 | #34 | Exceptional $55,932 |
| Tlingit-Haida | 100.0 /100 | #35 | Exceptional $55,914 |
| Immigrants | Israel | 100.0 /100 | #36 | Exceptional $55,913 |
| Immigrants | Russia | 100.0 /100 | #37 | Exceptional $55,891 |
| Immigrants | Iran | 100.0 /100 | #38 | Exceptional $55,880 |
| Immigrants | Belarus | 100.0 /100 | #39 | Exceptional $55,743 |
| Immigrants | Greece | 100.0 /100 | #40 | Exceptional $55,727 |
| Immigrants | Guyana | 100.0 /100 | #41 | Exceptional $55,726 |
| Immigrants | Korea | 100.0 /100 | #42 | Exceptional $55,716 |
| Immigrants | South Eastern Asia | 100.0 /100 | #43 | Exceptional $55,714 |
| Paraguayans | 100.0 /100 | #44 | Exceptional $55,614 |