Peruvian vs Paraguayan Householder Income Under 25 years
COMPARE
Peruvian
Paraguayan
Householder Income Under 25 years
Householder Income Under 25 years Comparison
Peruvians
Paraguayans
$56,052
HOUSEHOLDER INCOME UNDER 25 YEARS
100.0/ 100
METRIC RATING
32nd/ 347
METRIC RANK
$55,614
HOUSEHOLDER INCOME UNDER 25 YEARS
100.0/ 100
METRIC RATING
44th/ 347
METRIC RANK
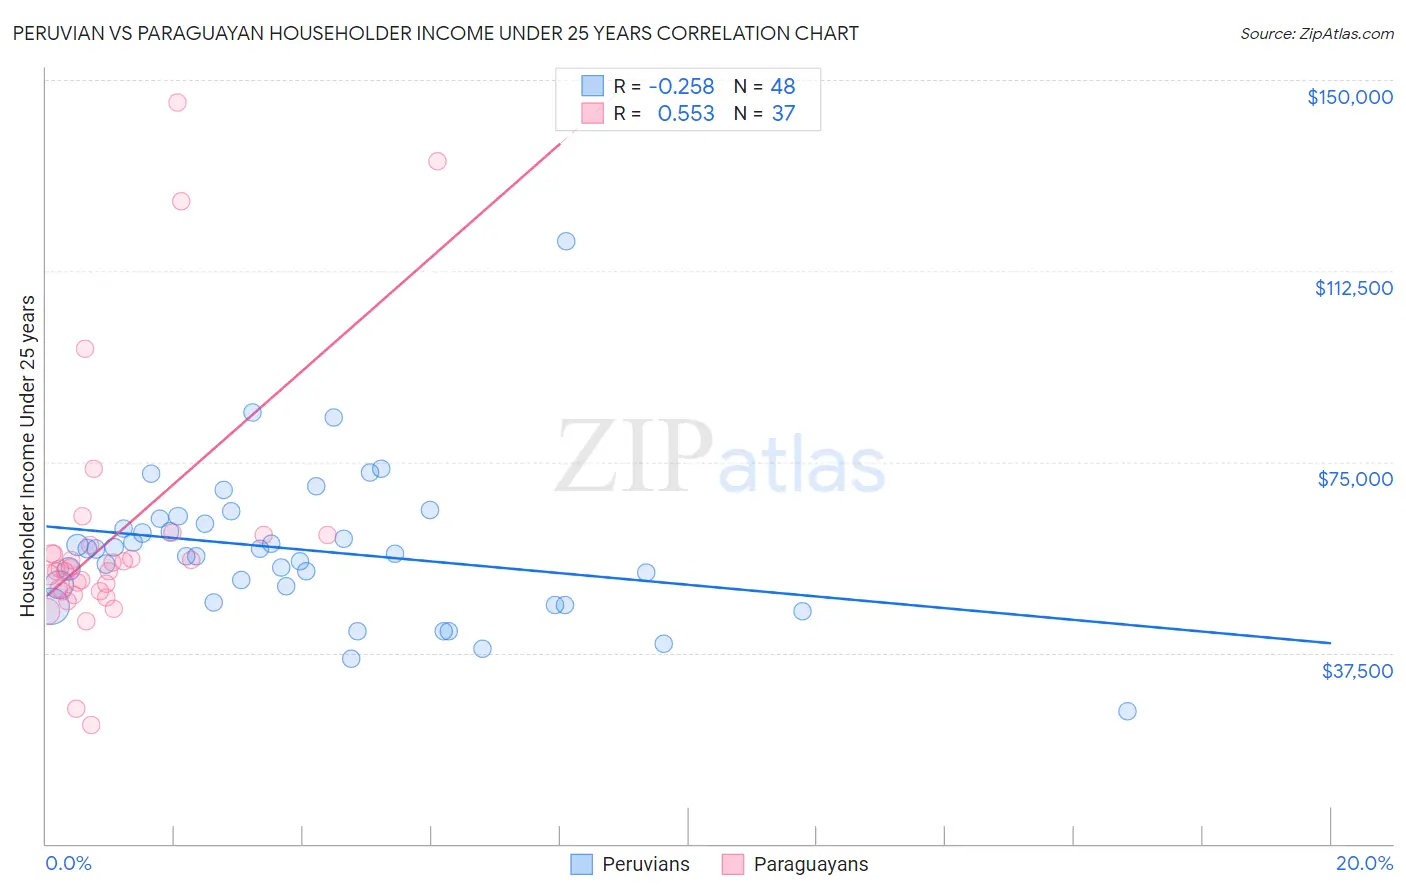
Peruvian vs Paraguayan Householder Income Under 25 years Correlation Chart
The statistical analysis conducted on geographies consisting of 309,109,247 people shows a weak negative correlation between the proportion of Peruvians and household income with householder under the age of 25 in the United States with a correlation coefficient (R) of -0.258 and weighted average of $56,052. Similarly, the statistical analysis conducted on geographies consisting of 88,924,769 people shows a substantial positive correlation between the proportion of Paraguayans and household income with householder under the age of 25 in the United States with a correlation coefficient (R) of 0.553 and weighted average of $55,614, a difference of 0.79%.
Householder Income Under 25 years Correlation Summary
| Measurement | Peruvian | Paraguayan |
| Minimum | $25,923 | $23,438 |
| Maximum | $118,438 | $145,536 |
| Range | $92,515 | $122,098 |
| Mean | $57,665 | $60,245 |
| Median | $57,415 | $54,059 |
| Interquartile 25% (IQ1) | $48,987 | $49,601 |
| Interquartile 75% (IQ3) | $63,410 | $59,594 |
| Interquartile Range (IQR) | $14,423 | $9,992 |
| Standard Deviation (Sample) | $14,693 | $25,388 |
| Standard Deviation (Population) | $14,539 | $25,042 |
Demographics Similar to Peruvians and Paraguayans by Householder Income Under 25 years
In terms of householder income under 25 years, the demographic groups most similar to Peruvians are Vietnamese ($56,127, a difference of 0.13%), Immigrants from Moldova ($56,168, a difference of 0.21%), Inupiat ($55,935, a difference of 0.21%), Immigrants from Japan ($55,932, a difference of 0.21%), and Tlingit-Haida ($55,914, a difference of 0.25%). Similarly, the demographic groups most similar to Paraguayans are Spanish American Indian ($55,573, a difference of 0.070%), Immigrants from Eastern Europe ($55,572, a difference of 0.070%), Cambodian ($55,571, a difference of 0.080%), Immigrants from Vietnam ($55,562, a difference of 0.090%), and Immigrants from Korea ($55,716, a difference of 0.18%).
| Demographics | Rating | Rank | Householder Income Under 25 years |
| Immigrants | Peru | 100.0 /100 | #28 | Exceptional $56,384 |
| Immigrants | Asia | 100.0 /100 | #29 | Exceptional $56,379 |
| Immigrants | Moldova | 100.0 /100 | #30 | Exceptional $56,168 |
| Vietnamese | 100.0 /100 | #31 | Exceptional $56,127 |
| Peruvians | 100.0 /100 | #32 | Exceptional $56,052 |
| Inupiat | 100.0 /100 | #33 | Exceptional $55,935 |
| Immigrants | Japan | 100.0 /100 | #34 | Exceptional $55,932 |
| Tlingit-Haida | 100.0 /100 | #35 | Exceptional $55,914 |
| Immigrants | Israel | 100.0 /100 | #36 | Exceptional $55,913 |
| Immigrants | Russia | 100.0 /100 | #37 | Exceptional $55,891 |
| Immigrants | Iran | 100.0 /100 | #38 | Exceptional $55,880 |
| Immigrants | Belarus | 100.0 /100 | #39 | Exceptional $55,743 |
| Immigrants | Greece | 100.0 /100 | #40 | Exceptional $55,727 |
| Immigrants | Guyana | 100.0 /100 | #41 | Exceptional $55,726 |
| Immigrants | Korea | 100.0 /100 | #42 | Exceptional $55,716 |
| Immigrants | South Eastern Asia | 100.0 /100 | #43 | Exceptional $55,714 |
| Paraguayans | 100.0 /100 | #44 | Exceptional $55,614 |
| Spanish American Indians | 100.0 /100 | #45 | Exceptional $55,573 |
| Immigrants | Eastern Europe | 100.0 /100 | #46 | Exceptional $55,572 |
| Cambodians | 100.0 /100 | #47 | Exceptional $55,571 |
| Immigrants | Vietnam | 100.0 /100 | #48 | Exceptional $55,562 |