White/Caucasian vs Paraguayan Householder Income Ages 25 - 44 years
COMPARE
White/Caucasian
Paraguayan
Householder Income Ages 25 - 44 years
Householder Income Ages 25 - 44 years Comparison
Whites/Caucasians
Paraguayans
$91,668
HOUSEHOLDER INCOME AGES 25 - 44 YEARS
16.7/ 100
METRIC RATING
200th/ 347
METRIC RANK
$106,615
HOUSEHOLDER INCOME AGES 25 - 44 YEARS
99.9/ 100
METRIC RATING
54th/ 347
METRIC RANK
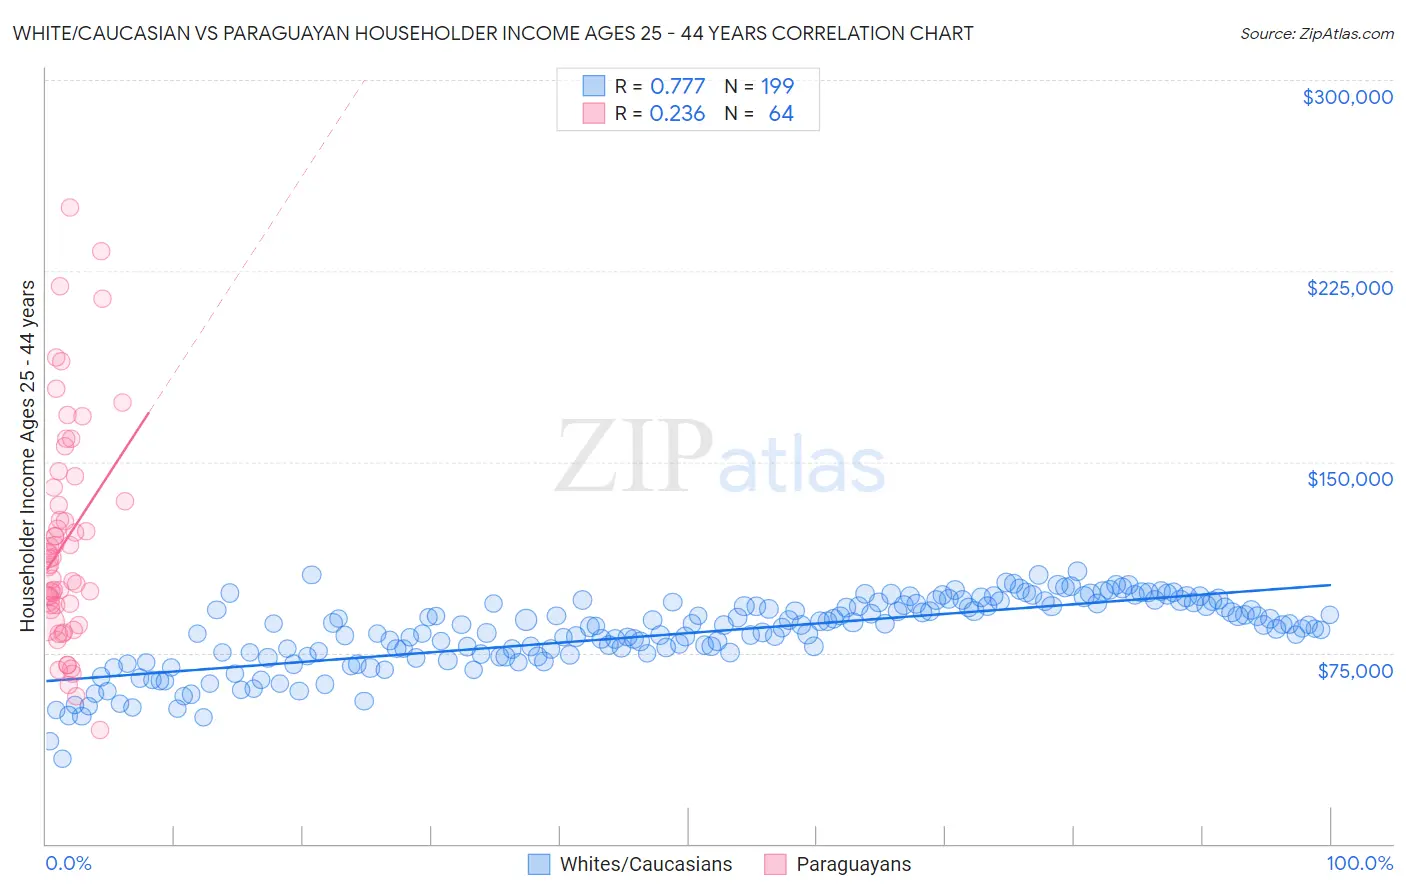
White/Caucasian vs Paraguayan Householder Income Ages 25 - 44 years Correlation Chart
The statistical analysis conducted on geographies consisting of 574,090,694 people shows a strong positive correlation between the proportion of Whites/Caucasians and household income with householder between the ages 25 and 44 in the United States with a correlation coefficient (R) of 0.777 and weighted average of $91,668. Similarly, the statistical analysis conducted on geographies consisting of 95,064,086 people shows a weak positive correlation between the proportion of Paraguayans and household income with householder between the ages 25 and 44 in the United States with a correlation coefficient (R) of 0.236 and weighted average of $106,615, a difference of 16.3%.
Householder Income Ages 25 - 44 years Correlation Summary
| Measurement | White/Caucasian | Paraguayan |
| Minimum | $33,408 | $44,531 |
| Maximum | $107,218 | $250,001 |
| Range | $73,811 | $205,470 |
| Mean | $82,806 | $118,848 |
| Median | $86,008 | $110,860 |
| Interquartile 25% (IQ1) | $74,387 | $92,713 |
| Interquartile 75% (IQ3) | $94,127 | $137,201 |
| Interquartile Range (IQR) | $19,740 | $44,488 |
| Standard Deviation (Sample) | $14,065 | $43,421 |
| Standard Deviation (Population) | $14,029 | $43,080 |
Similar Demographics by Householder Income Ages 25 - 44 years
Demographics Similar to Whites/Caucasians by Householder Income Ages 25 - 44 years
In terms of householder income ages 25 - 44 years, the demographic groups most similar to Whites/Caucasians are Kenyan ($91,684, a difference of 0.020%), Japanese ($91,624, a difference of 0.050%), Ecuadorian ($91,574, a difference of 0.10%), Immigrants from Cambodia ($91,533, a difference of 0.15%), and Nepalese ($91,498, a difference of 0.19%).
| Demographics | Rating | Rank | Householder Income Ages 25 - 44 years |
| Samoans | 23.0 /100 | #193 | Fair $92,385 |
| Immigrants | Azores | 22.4 /100 | #194 | Fair $92,322 |
| Celtics | 21.6 /100 | #195 | Fair $92,241 |
| Immigrants | Colombia | 21.3 /100 | #196 | Fair $92,204 |
| Spanish | 21.2 /100 | #197 | Fair $92,200 |
| Vietnamese | 20.2 /100 | #198 | Fair $92,089 |
| Kenyans | 16.8 /100 | #199 | Poor $91,684 |
| Whites/Caucasians | 16.7 /100 | #200 | Poor $91,668 |
| Japanese | 16.4 /100 | #201 | Poor $91,624 |
| Ecuadorians | 16.0 /100 | #202 | Poor $91,574 |
| Immigrants | Cambodia | 15.7 /100 | #203 | Poor $91,533 |
| Nepalese | 15.4 /100 | #204 | Poor $91,498 |
| Immigrants | Eastern Africa | 15.2 /100 | #205 | Poor $91,458 |
| Aleuts | 14.5 /100 | #206 | Poor $91,370 |
| Yugoslavians | 14.5 /100 | #207 | Poor $91,368 |
Demographics Similar to Paraguayans by Householder Income Ages 25 - 44 years
In terms of householder income ages 25 - 44 years, the demographic groups most similar to Paraguayans are Immigrants from Norway ($106,629, a difference of 0.010%), Greek ($106,457, a difference of 0.15%), Immigrants from Europe ($106,817, a difference of 0.19%), Immigrants from Czechoslovakia ($106,888, a difference of 0.26%), and Immigrants from Pakistan ($106,129, a difference of 0.46%).
| Demographics | Rating | Rank | Householder Income Ages 25 - 44 years |
| Estonians | 99.9 /100 | #47 | Exceptional $107,269 |
| Bulgarians | 99.9 /100 | #48 | Exceptional $107,264 |
| Immigrants | Turkey | 99.9 /100 | #49 | Exceptional $107,258 |
| Cambodians | 99.9 /100 | #50 | Exceptional $107,148 |
| Immigrants | Czechoslovakia | 99.9 /100 | #51 | Exceptional $106,888 |
| Immigrants | Europe | 99.9 /100 | #52 | Exceptional $106,817 |
| Immigrants | Norway | 99.9 /100 | #53 | Exceptional $106,629 |
| Paraguayans | 99.9 /100 | #54 | Exceptional $106,615 |
| Greeks | 99.9 /100 | #55 | Exceptional $106,457 |
| Immigrants | Pakistan | 99.8 /100 | #56 | Exceptional $106,129 |
| Immigrants | Austria | 99.8 /100 | #57 | Exceptional $106,103 |
| Immigrants | South Africa | 99.8 /100 | #58 | Exceptional $105,748 |
| Immigrants | Latvia | 99.8 /100 | #59 | Exceptional $105,522 |
| Egyptians | 99.7 /100 | #60 | Exceptional $105,282 |
| Lithuanians | 99.7 /100 | #61 | Exceptional $105,223 |