Immigrants from Uruguay vs Paiute Householder Income Under 25 years
COMPARE
Immigrants from Uruguay
Paiute
Householder Income Under 25 years
Householder Income Under 25 years Comparison
Immigrants from Uruguay
Paiute
$52,302
HOUSEHOLDER INCOME UNDER 25 YEARS
56.8/ 100
METRIC RATING
171st/ 347
METRIC RANK
$51,743
HOUSEHOLDER INCOME UNDER 25 YEARS
25.1/ 100
METRIC RATING
184th/ 347
METRIC RANK
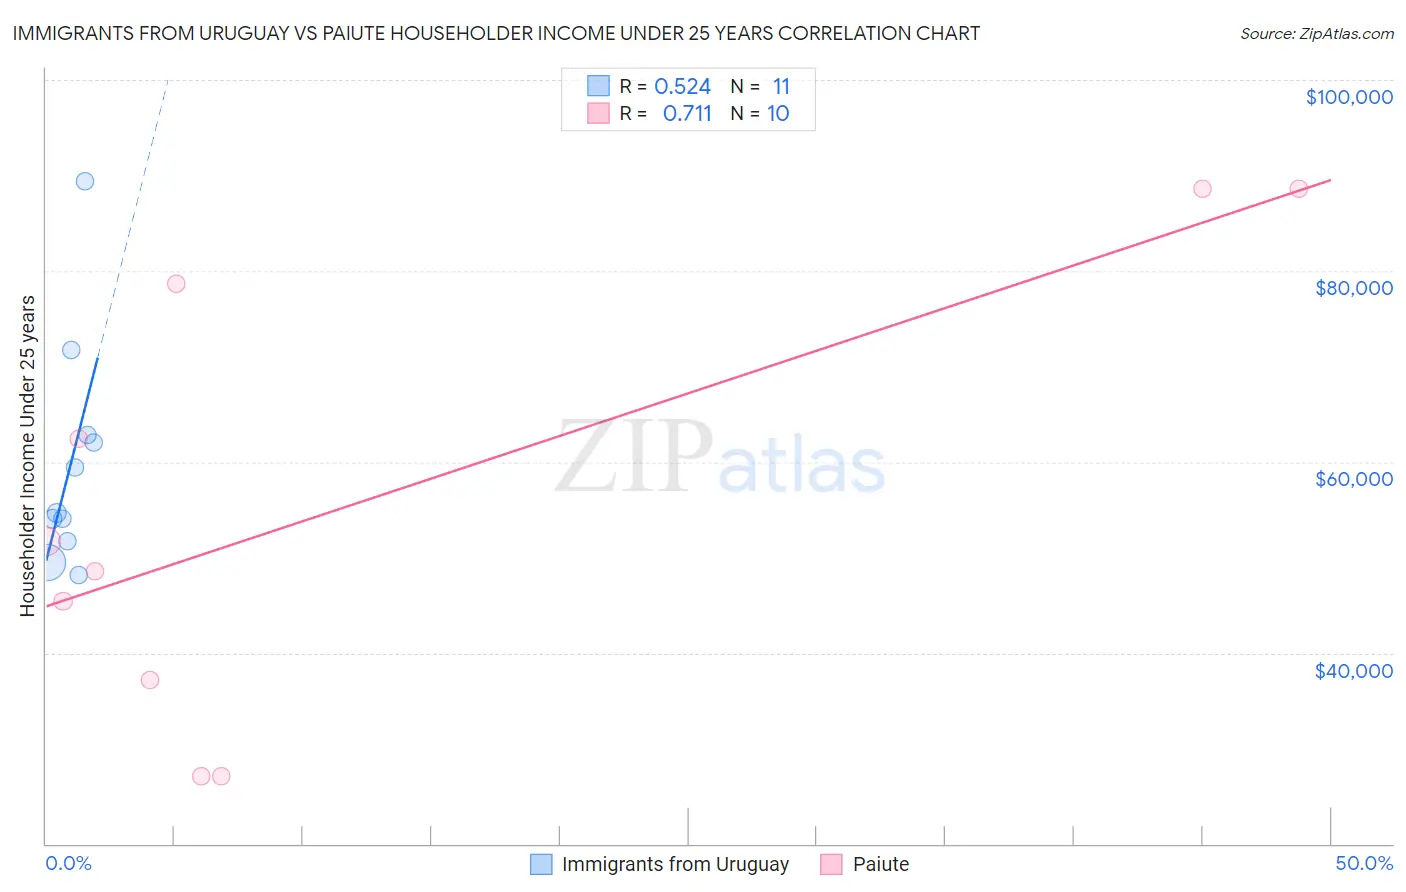
Immigrants from Uruguay vs Paiute Householder Income Under 25 years Correlation Chart
The statistical analysis conducted on geographies consisting of 120,970,355 people shows a substantial positive correlation between the proportion of Immigrants from Uruguay and household income with householder under the age of 25 in the United States with a correlation coefficient (R) of 0.524 and weighted average of $52,302. Similarly, the statistical analysis conducted on geographies consisting of 55,798,660 people shows a strong positive correlation between the proportion of Paiute and household income with householder under the age of 25 in the United States with a correlation coefficient (R) of 0.711 and weighted average of $51,743, a difference of 1.1%.
Householder Income Under 25 years Correlation Summary
| Measurement | Immigrants from Uruguay | Paiute |
| Minimum | $48,209 | $27,120 |
| Maximum | $89,343 | $88,654 |
| Range | $41,134 | $61,534 |
| Mean | $59,760 | $55,543 |
| Median | $54,632 | $50,117 |
| Interquartile 25% (IQ1) | $51,644 | $37,118 |
| Interquartile 75% (IQ3) | $62,813 | $78,623 |
| Interquartile Range (IQR) | $11,169 | $41,505 |
| Standard Deviation (Sample) | $11,950 | $23,320 |
| Standard Deviation (Population) | $11,394 | $22,123 |
Demographics Similar to Immigrants from Uruguay and Paiute by Householder Income Under 25 years
In terms of householder income under 25 years, the demographic groups most similar to Immigrants from Uruguay are Israeli ($52,335, a difference of 0.060%), Canadian ($52,336, a difference of 0.070%), Japanese ($52,365, a difference of 0.12%), Immigrants from Uganda ($52,374, a difference of 0.14%), and Cypriot ($52,209, a difference of 0.18%). Similarly, the demographic groups most similar to Paiute are Immigrants from Latvia ($51,737, a difference of 0.010%), Alaskan Athabascan ($51,713, a difference of 0.060%), Immigrants from South Africa ($51,705, a difference of 0.070%), Mexican American Indian ($51,783, a difference of 0.080%), and European ($51,796, a difference of 0.10%).
| Demographics | Rating | Rank | Householder Income Under 25 years |
| Immigrants | Uganda | 61.1 /100 | #167 | Good $52,374 |
| Japanese | 60.5 /100 | #168 | Good $52,365 |
| Canadians | 58.8 /100 | #169 | Average $52,336 |
| Israelis | 58.8 /100 | #170 | Average $52,335 |
| Immigrants | Uruguay | 56.8 /100 | #171 | Average $52,302 |
| Cypriots | 51.2 /100 | #172 | Average $52,209 |
| Barbadians | 50.8 /100 | #173 | Average $52,202 |
| Immigrants | Western Asia | 50.0 /100 | #174 | Average $52,190 |
| Immigrants | Zimbabwe | 33.8 /100 | #175 | Fair $51,914 |
| Austrians | 32.9 /100 | #176 | Fair $51,898 |
| British West Indians | 30.0 /100 | #177 | Fair $51,844 |
| Finns | 29.2 /100 | #178 | Fair $51,827 |
| Basques | 28.7 /100 | #179 | Fair $51,818 |
| Immigrants | England | 28.7 /100 | #180 | Fair $51,817 |
| Europeans | 27.6 /100 | #181 | Fair $51,796 |
| Jordanians | 27.6 /100 | #182 | Fair $51,796 |
| Mexican American Indians | 27.0 /100 | #183 | Fair $51,783 |
| Paiute | 25.1 /100 | #184 | Fair $51,743 |
| Immigrants | Latvia | 24.8 /100 | #185 | Fair $51,737 |
| Alaskan Athabascans | 23.8 /100 | #186 | Fair $51,713 |
| Immigrants | South Africa | 23.4 /100 | #187 | Fair $51,705 |