White/Caucasian vs Nicaraguan In Labor Force | Age 16-19
COMPARE
White/Caucasian
Nicaraguan
In Labor Force | Age 16-19
In Labor Force | Age 16-19 Comparison
Whites/Caucasians
Nicaraguans
41.3%
IN LABOR FORCE | AGE 16-19
100.0/ 100
METRIC RATING
42nd/ 347
METRIC RANK
32.4%
IN LABOR FORCE | AGE 16-19
0.0/ 100
METRIC RATING
305th/ 347
METRIC RANK
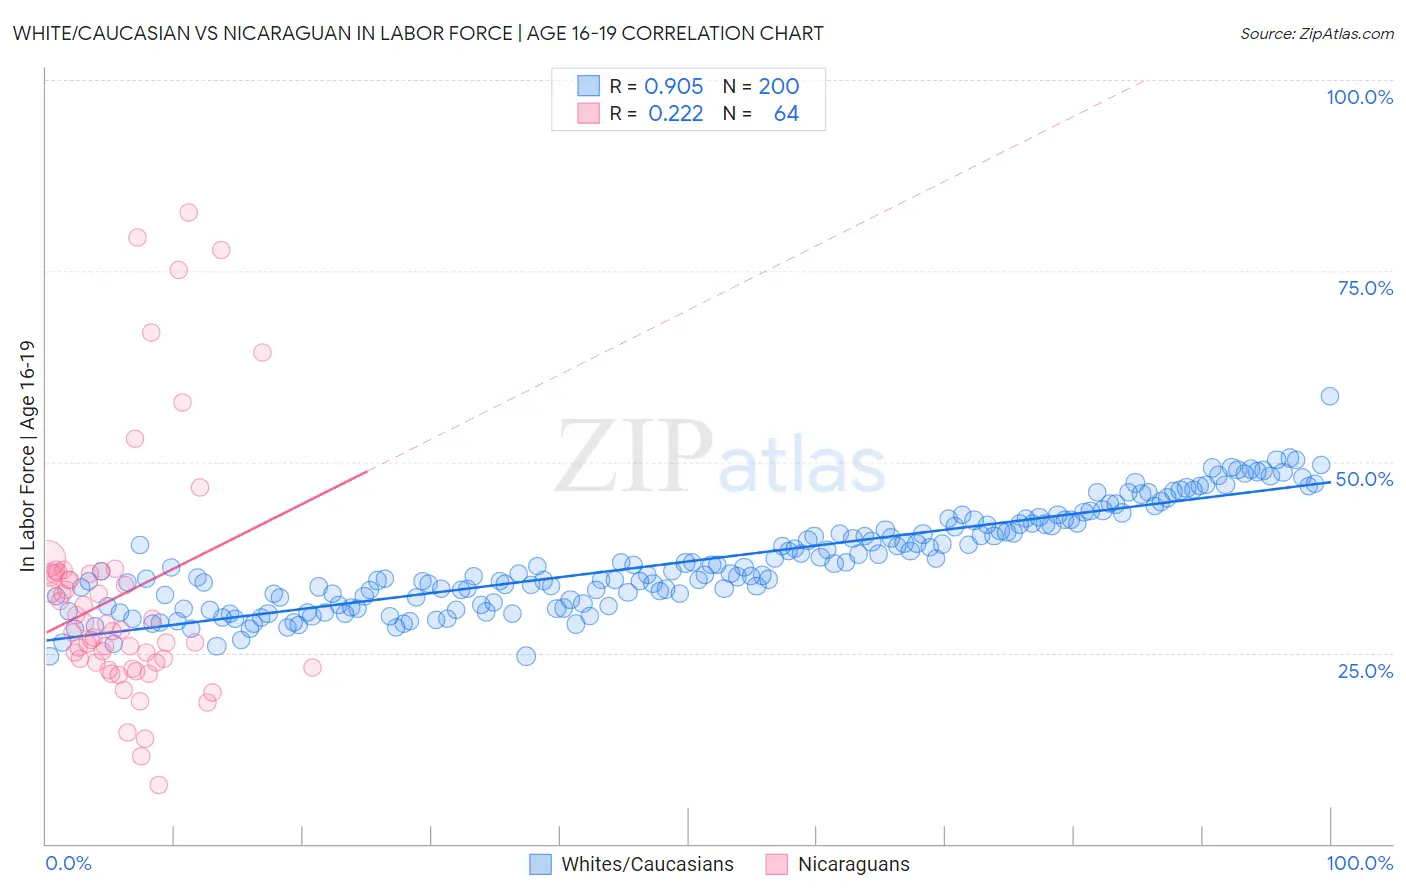
White/Caucasian vs Nicaraguan In Labor Force | Age 16-19 Correlation Chart
The statistical analysis conducted on geographies consisting of 578,396,700 people shows a near-perfect positive correlation between the proportion of Whites/Caucasians and labor force participation rate among population between the ages 16 and 19 in the United States with a correlation coefficient (R) of 0.905 and weighted average of 41.3%. Similarly, the statistical analysis conducted on geographies consisting of 285,526,863 people shows a weak positive correlation between the proportion of Nicaraguans and labor force participation rate among population between the ages 16 and 19 in the United States with a correlation coefficient (R) of 0.222 and weighted average of 32.4%, a difference of 27.5%.
In Labor Force | Age 16-19 Correlation Summary
| Measurement | White/Caucasian | Nicaraguan |
| Minimum | 24.5% | 7.7% |
| Maximum | 58.6% | 82.6% |
| Range | 34.1% | 74.9% |
| Mean | 37.0% | 32.6% |
| Median | 35.4% | 27.9% |
| Interquartile 25% (IQ1) | 31.4% | 23.7% |
| Interquartile 75% (IQ3) | 41.8% | 35.4% |
| Interquartile Range (IQR) | 10.5% | 11.7% |
| Standard Deviation (Sample) | 6.6% | 16.0% |
| Standard Deviation (Population) | 6.6% | 15.9% |
Similar Demographics by In Labor Force | Age 16-19
Demographics Similar to Whites/Caucasians by In Labor Force | Age 16-19
In terms of in labor force | age 16-19, the demographic groups most similar to Whites/Caucasians are Celtic (41.3%, a difference of 0.010%), Tongan (41.2%, a difference of 0.30%), Immigrants from Liberia (41.5%, a difference of 0.35%), European (41.1%, a difference of 0.41%), and Scotch-Irish (41.5%, a difference of 0.45%).
| Demographics | Rating | Rank | In Labor Force | Age 16-19 |
| Yugoslavians | 100.0 /100 | #35 | Exceptional 41.8% |
| Immigrants | Azores | 100.0 /100 | #36 | Exceptional 41.7% |
| Immigrants | Congo | 100.0 /100 | #37 | Exceptional 41.7% |
| Sioux | 100.0 /100 | #38 | Exceptional 41.5% |
| Scotch-Irish | 100.0 /100 | #39 | Exceptional 41.5% |
| Immigrants | Liberia | 100.0 /100 | #40 | Exceptional 41.5% |
| Celtics | 100.0 /100 | #41 | Exceptional 41.3% |
| Whites/Caucasians | 100.0 /100 | #42 | Exceptional 41.3% |
| Tongans | 100.0 /100 | #43 | Exceptional 41.2% |
| Europeans | 100.0 /100 | #44 | Exceptional 41.1% |
| Croatians | 100.0 /100 | #45 | Exceptional 41.1% |
| Immigrants | Sudan | 100.0 /100 | #46 | Exceptional 41.0% |
| Carpatho Rusyns | 100.0 /100 | #47 | Exceptional 40.8% |
| Icelanders | 100.0 /100 | #48 | Exceptional 40.8% |
| Cree | 100.0 /100 | #49 | Exceptional 40.8% |
Demographics Similar to Nicaraguans by In Labor Force | Age 16-19
In terms of in labor force | age 16-19, the demographic groups most similar to Nicaraguans are Israeli (32.4%, a difference of 0.050%), Spanish American Indian (32.4%, a difference of 0.13%), Immigrants from Dominica (32.5%, a difference of 0.24%), Immigrants from Jamaica (32.2%, a difference of 0.62%), and Navajo (32.1%, a difference of 0.97%).
| Demographics | Rating | Rank | In Labor Force | Age 16-19 |
| Iranians | 0.0 /100 | #298 | Tragic 33.0% |
| Armenians | 0.0 /100 | #299 | Tragic 32.9% |
| Immigrants | Argentina | 0.0 /100 | #300 | Tragic 32.9% |
| Okinawans | 0.0 /100 | #301 | Tragic 32.8% |
| Belizeans | 0.0 /100 | #302 | Tragic 32.8% |
| Immigrants | Dominica | 0.0 /100 | #303 | Tragic 32.5% |
| Israelis | 0.0 /100 | #304 | Tragic 32.4% |
| Nicaraguans | 0.0 /100 | #305 | Tragic 32.4% |
| Spanish American Indians | 0.0 /100 | #306 | Tragic 32.4% |
| Immigrants | Jamaica | 0.0 /100 | #307 | Tragic 32.2% |
| Navajo | 0.0 /100 | #308 | Tragic 32.1% |
| Immigrants | Eastern Asia | 0.0 /100 | #309 | Tragic 32.0% |
| Immigrants | Iran | 0.0 /100 | #310 | Tragic 32.0% |
| Indians (Asian) | 0.0 /100 | #311 | Tragic 31.9% |
| Immigrants | Belize | 0.0 /100 | #312 | Tragic 31.8% |