West Indian vs Immigrants from Australia Seniors Poverty Over the Age of 75
COMPARE
West Indian
Immigrants from Australia
Seniors Poverty Over the Age of 75
Seniors Poverty Over the Age of 75 Comparison
West Indians
Immigrants from Australia
15.7%
SENIORS POVERTY OVER THE AGE OF 75
0.0/ 100
METRIC RATING
302nd/ 347
METRIC RANK
12.2%
SENIORS POVERTY OVER THE AGE OF 75
44.2/ 100
METRIC RATING
181st/ 347
METRIC RANK
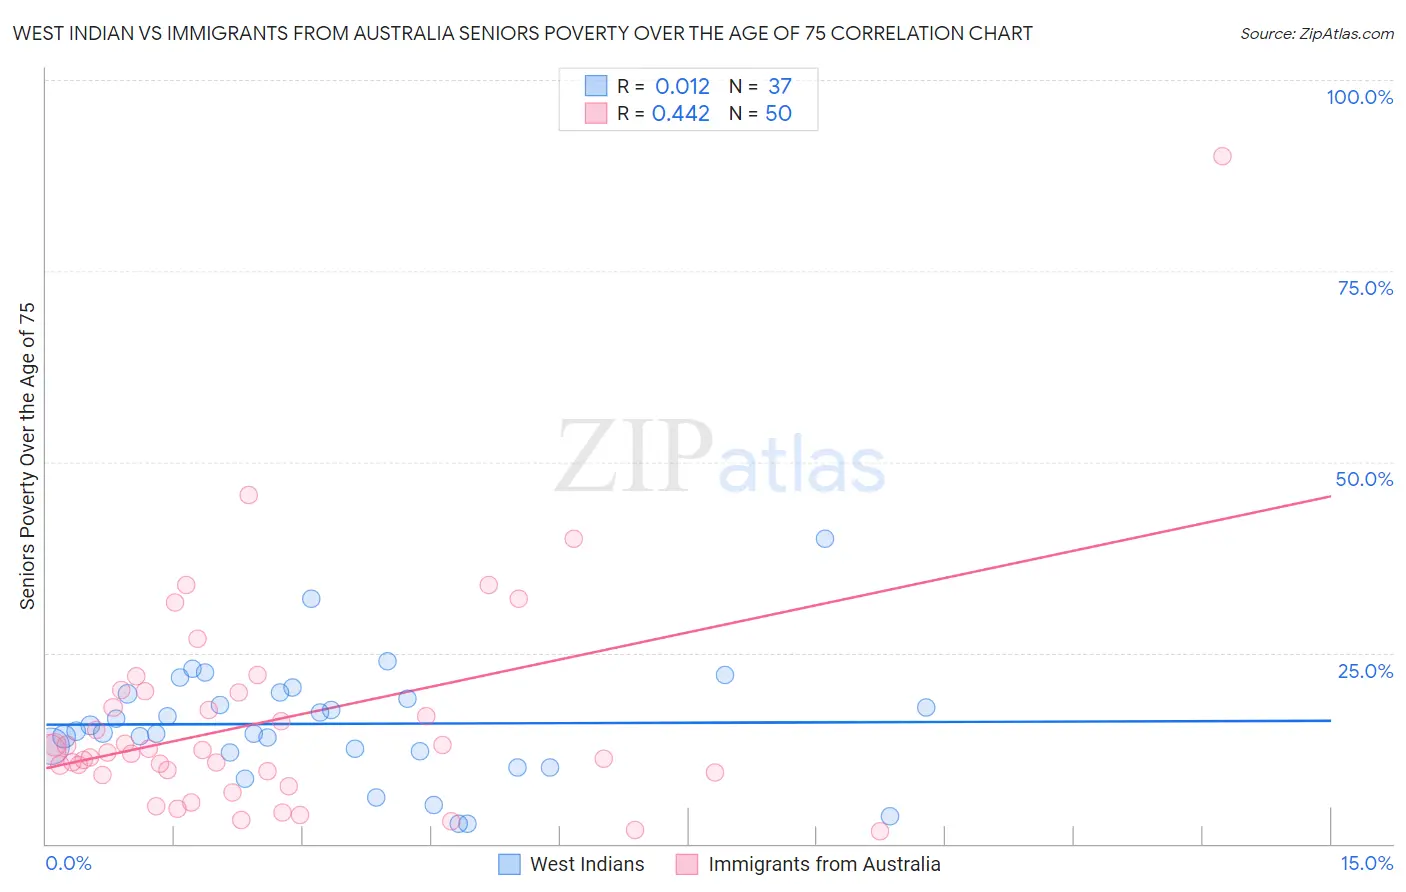
West Indian vs Immigrants from Australia Seniors Poverty Over the Age of 75 Correlation Chart
The statistical analysis conducted on geographies consisting of 252,374,220 people shows no correlation between the proportion of West Indians and poverty level among seniors over the age of 75 in the United States with a correlation coefficient (R) of 0.012 and weighted average of 15.7%. Similarly, the statistical analysis conducted on geographies consisting of 225,278,239 people shows a moderate positive correlation between the proportion of Immigrants from Australia and poverty level among seniors over the age of 75 in the United States with a correlation coefficient (R) of 0.442 and weighted average of 12.2%, a difference of 28.1%.
Seniors Poverty Over the Age of 75 Correlation Summary
| Measurement | West Indian | Immigrants from Australia |
| Minimum | 2.6% | 1.7% |
| Maximum | 40.0% | 90.0% |
| Range | 37.4% | 88.3% |
| Mean | 15.7% | 16.1% |
| Median | 14.8% | 12.0% |
| Interquartile 25% (IQ1) | 12.1% | 9.3% |
| Interquartile 75% (IQ3) | 19.7% | 19.8% |
| Interquartile Range (IQR) | 7.6% | 10.5% |
| Standard Deviation (Sample) | 7.6% | 14.6% |
| Standard Deviation (Population) | 7.5% | 14.4% |
Similar Demographics by Seniors Poverty Over the Age of 75
Demographics Similar to West Indians by Seniors Poverty Over the Age of 75
In terms of seniors poverty over the age of 75, the demographic groups most similar to West Indians are Immigrants from Honduras (15.7%, a difference of 0.17%), Immigrants from Latin America (15.6%, a difference of 0.31%), Immigrants from Trinidad and Tobago (15.7%, a difference of 0.35%), Ecuadorian (15.7%, a difference of 0.39%), and Hispanic or Latino (15.8%, a difference of 0.55%).
| Demographics | Rating | Rank | Seniors Poverty Over the Age of 75 |
| U.S. Virgin Islanders | 0.0 /100 | #295 | Tragic 15.4% |
| Yuman | 0.0 /100 | #296 | Tragic 15.4% |
| Hondurans | 0.0 /100 | #297 | Tragic 15.4% |
| Natives/Alaskans | 0.0 /100 | #298 | Tragic 15.5% |
| Spanish American Indians | 0.0 /100 | #299 | Tragic 15.5% |
| Bahamians | 0.0 /100 | #300 | Tragic 15.5% |
| Immigrants | Latin America | 0.0 /100 | #301 | Tragic 15.6% |
| West Indians | 0.0 /100 | #302 | Tragic 15.7% |
| Immigrants | Honduras | 0.0 /100 | #303 | Tragic 15.7% |
| Immigrants | Trinidad and Tobago | 0.0 /100 | #304 | Tragic 15.7% |
| Ecuadorians | 0.0 /100 | #305 | Tragic 15.7% |
| Hispanics or Latinos | 0.0 /100 | #306 | Tragic 15.8% |
| Immigrants | West Indies | 0.0 /100 | #307 | Tragic 15.8% |
| Immigrants | Bangladesh | 0.0 /100 | #308 | Tragic 15.8% |
| Yup'ik | 0.0 /100 | #309 | Tragic 15.8% |
Demographics Similar to Immigrants from Australia by Seniors Poverty Over the Age of 75
In terms of seniors poverty over the age of 75, the demographic groups most similar to Immigrants from Australia are Immigrants from South Eastern Asia (12.2%, a difference of 0.010%), Mongolian (12.2%, a difference of 0.11%), Nonimmigrants (12.2%, a difference of 0.22%), German Russian (12.3%, a difference of 0.23%), and Immigrants from Asia (12.2%, a difference of 0.30%).
| Demographics | Rating | Rank | Seniors Poverty Over the Age of 75 |
| Immigrants | Europe | 50.0 /100 | #174 | Average 12.2% |
| Immigrants | Saudi Arabia | 49.5 /100 | #175 | Average 12.2% |
| Immigrants | Iran | 48.1 /100 | #176 | Average 12.2% |
| Immigrants | Asia | 47.8 /100 | #177 | Average 12.2% |
| Immigrants | Nonimmigrants | 46.8 /100 | #178 | Average 12.2% |
| Mongolians | 45.5 /100 | #179 | Average 12.2% |
| Immigrants | South Eastern Asia | 44.3 /100 | #180 | Average 12.2% |
| Immigrants | Australia | 44.2 /100 | #181 | Average 12.2% |
| German Russians | 41.4 /100 | #182 | Average 12.3% |
| Laotians | 38.2 /100 | #183 | Fair 12.3% |
| Kiowa | 36.0 /100 | #184 | Fair 12.3% |
| Immigrants | Malaysia | 35.8 /100 | #185 | Fair 12.3% |
| Sri Lankans | 32.3 /100 | #186 | Fair 12.4% |
| Yaqui | 25.9 /100 | #187 | Fair 12.5% |
| Immigrants | Northern Africa | 25.2 /100 | #188 | Fair 12.5% |