Turkish vs Immigrants from Latvia Unemployment Among Women with Children Under 6 years
COMPARE
Turkish
Immigrants from Latvia
Unemployment Among Women with Children Under 6 years
Unemployment Among Women with Children Under 6 years Comparison
Turks
Immigrants from Latvia
7.0%
UNEMPLOYMENT AMONG WOMEN WITH CHILDREN UNDER 6 YEARS
99.2/ 100
METRIC RATING
74th/ 347
METRIC RANK
6.8%
UNEMPLOYMENT AMONG WOMEN WITH CHILDREN UNDER 6 YEARS
99.9/ 100
METRIC RATING
54th/ 347
METRIC RANK
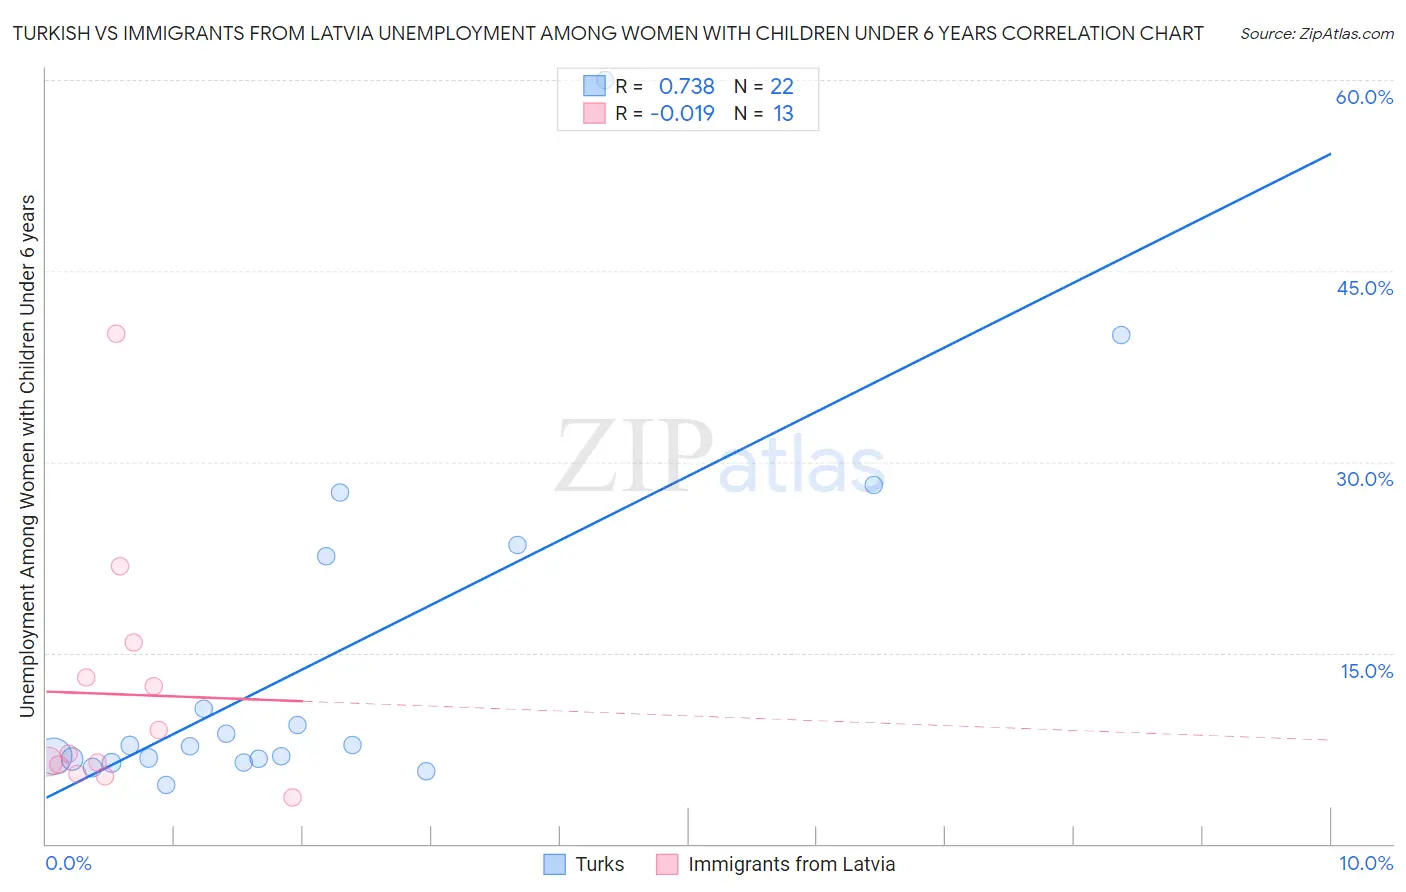
Turkish vs Immigrants from Latvia Unemployment Among Women with Children Under 6 years Correlation Chart
The statistical analysis conducted on geographies consisting of 219,764,110 people shows a strong positive correlation between the proportion of Turks and unemployment rate among women with children under the age of 6 in the United States with a correlation coefficient (R) of 0.738 and weighted average of 7.0%. Similarly, the statistical analysis conducted on geographies consisting of 99,406,328 people shows no correlation between the proportion of Immigrants from Latvia and unemployment rate among women with children under the age of 6 in the United States with a correlation coefficient (R) of -0.019 and weighted average of 6.8%, a difference of 3.3%.
Unemployment Among Women with Children Under 6 years Correlation Summary
| Measurement | Turkish | Immigrants from Latvia |
| Minimum | 4.6% | 3.6% |
| Maximum | 60.0% | 40.1% |
| Range | 55.4% | 36.5% |
| Mean | 14.4% | 11.7% |
| Median | 7.7% | 7.1% |
| Interquartile 25% (IQ1) | 6.6% | 5.9% |
| Interquartile 75% (IQ3) | 22.6% | 14.4% |
| Interquartile Range (IQR) | 16.0% | 8.5% |
| Standard Deviation (Sample) | 14.0% | 9.9% |
| Standard Deviation (Population) | 13.7% | 9.6% |
Demographics Similar to Turks and Immigrants from Latvia by Unemployment Among Women with Children Under 6 years
In terms of unemployment among women with children under 6 years, the demographic groups most similar to Turks are Immigrants from Czechoslovakia (7.0%, a difference of 0.010%), Cuban (7.0%, a difference of 0.53%), Afghan (7.0%, a difference of 0.63%), Immigrants from Iraq (7.0%, a difference of 0.65%), and Immigrants from Eritrea (7.0%, a difference of 0.67%). Similarly, the demographic groups most similar to Immigrants from Latvia are Immigrants from Ukraine (6.8%, a difference of 0.49%), Immigrants from Ethiopia (6.9%, a difference of 0.59%), Icelander (6.9%, a difference of 0.60%), Immigrants from Turkey (6.9%, a difference of 0.83%), and Immigrants from Serbia (6.9%, a difference of 0.90%).
| Demographics | Rating | Rank | Unemployment Among Women with Children Under 6 years |
| Immigrants | Latvia | 99.9 /100 | #54 | Exceptional 6.8% |
| Immigrants | Ukraine | 99.8 /100 | #55 | Exceptional 6.8% |
| Immigrants | Ethiopia | 99.8 /100 | #56 | Exceptional 6.9% |
| Icelanders | 99.8 /100 | #57 | Exceptional 6.9% |
| Immigrants | Turkey | 99.8 /100 | #58 | Exceptional 6.9% |
| Immigrants | Serbia | 99.8 /100 | #59 | Exceptional 6.9% |
| Immigrants | Sri Lanka | 99.8 /100 | #60 | Exceptional 6.9% |
| Immigrants | France | 99.7 /100 | #61 | Exceptional 6.9% |
| Somalis | 99.7 /100 | #62 | Exceptional 6.9% |
| Maltese | 99.7 /100 | #63 | Exceptional 6.9% |
| Tongans | 99.7 /100 | #64 | Exceptional 6.9% |
| Immigrants | Kuwait | 99.7 /100 | #65 | Exceptional 6.9% |
| Immigrants | Belgium | 99.6 /100 | #66 | Exceptional 6.9% |
| Immigrants | Netherlands | 99.5 /100 | #67 | Exceptional 7.0% |
| Paraguayans | 99.4 /100 | #68 | Exceptional 7.0% |
| Immigrants | Eritrea | 99.4 /100 | #69 | Exceptional 7.0% |
| Immigrants | Iraq | 99.4 /100 | #70 | Exceptional 7.0% |
| Afghans | 99.4 /100 | #71 | Exceptional 7.0% |
| Cubans | 99.4 /100 | #72 | Exceptional 7.0% |
| Immigrants | Czechoslovakia | 99.2 /100 | #73 | Exceptional 7.0% |
| Turks | 99.2 /100 | #74 | Exceptional 7.0% |