Sioux vs Romanian Householder Income Over 65 years
COMPARE
Sioux
Romanian
Householder Income Over 65 years
Householder Income Over 65 years Comparison
Sioux
Romanians
$52,509
HOUSEHOLDER INCOME OVER 65 YEARS
0.0/ 100
METRIC RATING
310th/ 347
METRIC RANK
$64,142
HOUSEHOLDER INCOME OVER 65 YEARS
96.5/ 100
METRIC RATING
98th/ 347
METRIC RANK
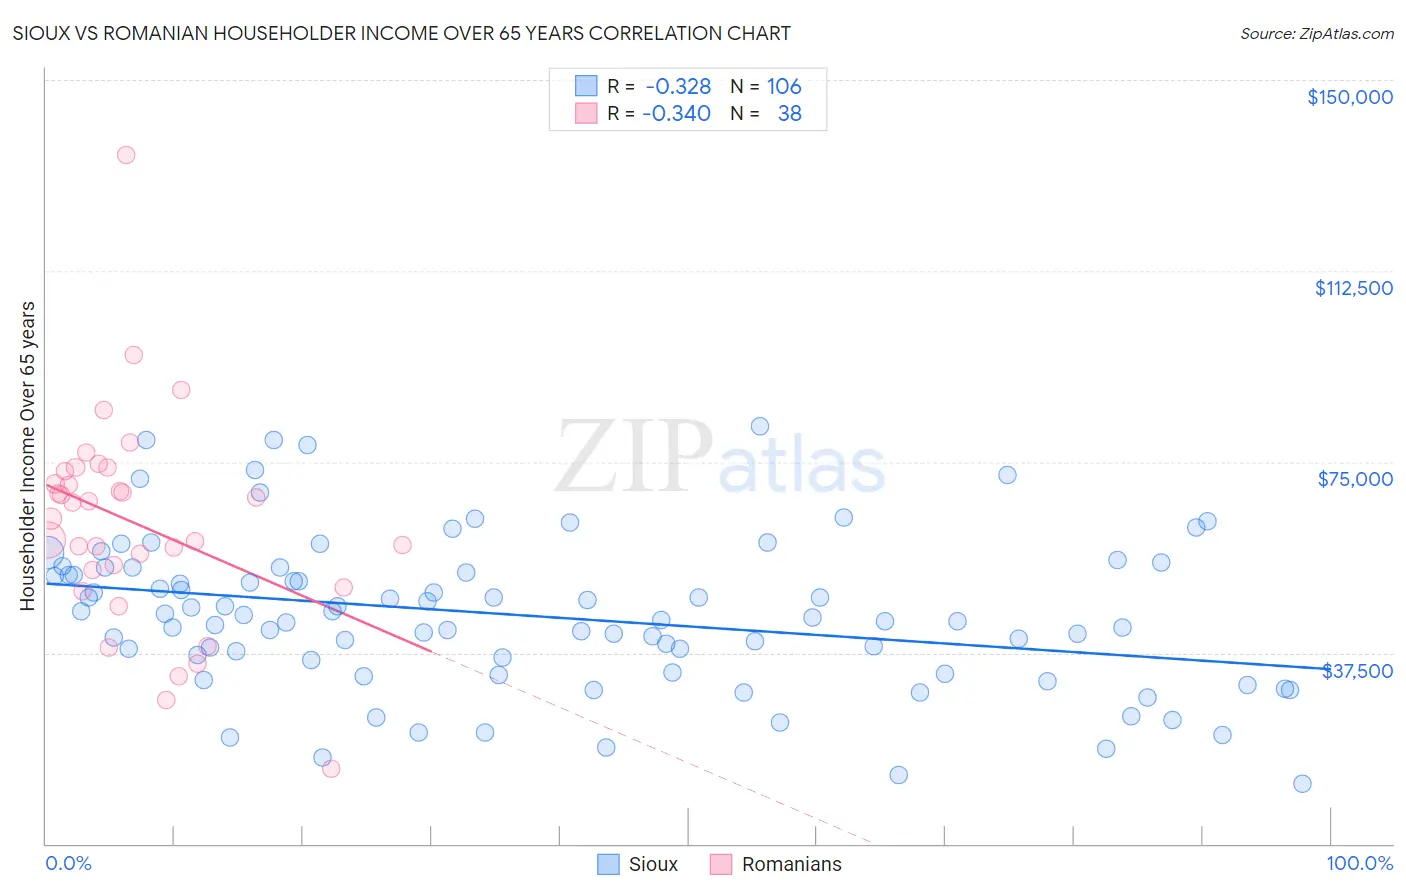
Sioux vs Romanian Householder Income Over 65 years Correlation Chart
The statistical analysis conducted on geographies consisting of 233,494,495 people shows a mild negative correlation between the proportion of Sioux and household income with householder over the age of 65 in the United States with a correlation coefficient (R) of -0.328 and weighted average of $52,509. Similarly, the statistical analysis conducted on geographies consisting of 376,856,051 people shows a mild negative correlation between the proportion of Romanians and household income with householder over the age of 65 in the United States with a correlation coefficient (R) of -0.340 and weighted average of $64,142, a difference of 22.2%.
Householder Income Over 65 years Correlation Summary
| Measurement | Sioux | Romanian |
| Minimum | $11,667 | $14,625 |
| Maximum | $81,875 | $135,238 |
| Range | $70,208 | $120,613 |
| Mean | $44,773 | $62,942 |
| Median | $44,286 | $65,425 |
| Interquartile 25% (IQ1) | $36,021 | $53,666 |
| Interquartile 75% (IQ3) | $53,333 | $73,079 |
| Interquartile Range (IQR) | $17,312 | $19,413 |
| Standard Deviation (Sample) | $14,854 | $20,808 |
| Standard Deviation (Population) | $14,783 | $20,532 |
Similar Demographics by Householder Income Over 65 years
Demographics Similar to Sioux by Householder Income Over 65 years
In terms of householder income over 65 years, the demographic groups most similar to Sioux are Honduran ($52,634, a difference of 0.24%), Seminole ($52,373, a difference of 0.26%), Immigrants from Mexico ($52,801, a difference of 0.56%), Hispanic or Latino ($52,832, a difference of 0.62%), and Pennsylvania German ($52,888, a difference of 0.72%).
| Demographics | Rating | Rank | Householder Income Over 65 years |
| Choctaw | 0.0 /100 | #303 | Tragic $53,060 |
| Ute | 0.0 /100 | #304 | Tragic $52,949 |
| Pueblo | 0.0 /100 | #305 | Tragic $52,930 |
| Pennsylvania Germans | 0.0 /100 | #306 | Tragic $52,888 |
| Hispanics or Latinos | 0.0 /100 | #307 | Tragic $52,832 |
| Immigrants | Mexico | 0.0 /100 | #308 | Tragic $52,801 |
| Hondurans | 0.0 /100 | #309 | Tragic $52,634 |
| Sioux | 0.0 /100 | #310 | Tragic $52,509 |
| Seminole | 0.0 /100 | #311 | Tragic $52,373 |
| Immigrants | Azores | 0.0 /100 | #312 | Tragic $52,121 |
| Immigrants | Nicaragua | 0.0 /100 | #313 | Tragic $52,085 |
| Natives/Alaskans | 0.0 /100 | #314 | Tragic $52,081 |
| U.S. Virgin Islanders | 0.0 /100 | #315 | Tragic $52,072 |
| Creek | 0.0 /100 | #316 | Tragic $51,949 |
| Immigrants | St. Vincent and the Grenadines | 0.0 /100 | #317 | Tragic $51,922 |
Demographics Similar to Romanians by Householder Income Over 65 years
In terms of householder income over 65 years, the demographic groups most similar to Romanians are Assyrian/Chaldean/Syriac ($64,108, a difference of 0.050%), Immigrants from South Eastern Asia ($64,089, a difference of 0.080%), Sri Lankan ($64,201, a difference of 0.090%), Immigrants from Italy ($64,065, a difference of 0.12%), and Immigrants from Hungary ($64,277, a difference of 0.21%).
| Demographics | Rating | Rank | Householder Income Over 65 years |
| Immigrants | Oceania | 97.4 /100 | #91 | Exceptional $64,416 |
| Immigrants | Bulgaria | 97.3 /100 | #92 | Exceptional $64,379 |
| Jordanians | 97.1 /100 | #93 | Exceptional $64,313 |
| Immigrants | Egypt | 97.0 /100 | #94 | Exceptional $64,299 |
| Immigrants | Latvia | 97.0 /100 | #95 | Exceptional $64,298 |
| Immigrants | Hungary | 97.0 /100 | #96 | Exceptional $64,277 |
| Sri Lankans | 96.7 /100 | #97 | Exceptional $64,201 |
| Romanians | 96.5 /100 | #98 | Exceptional $64,142 |
| Assyrians/Chaldeans/Syriacs | 96.4 /100 | #99 | Exceptional $64,108 |
| Immigrants | South Eastern Asia | 96.3 /100 | #100 | Exceptional $64,089 |
| Immigrants | Italy | 96.2 /100 | #101 | Exceptional $64,065 |
| Chileans | 95.8 /100 | #102 | Exceptional $63,957 |
| British | 95.7 /100 | #103 | Exceptional $63,940 |
| Immigrants | Cameroon | 95.6 /100 | #104 | Exceptional $63,907 |
| Italians | 95.5 /100 | #105 | Exceptional $63,885 |