Chilean vs Romanian Householder Income Over 65 years
COMPARE
Chilean
Romanian
Householder Income Over 65 years
Householder Income Over 65 years Comparison
Chileans
Romanians
$63,957
HOUSEHOLDER INCOME OVER 65 YEARS
95.8/ 100
METRIC RATING
102nd/ 347
METRIC RANK
$64,142
HOUSEHOLDER INCOME OVER 65 YEARS
96.5/ 100
METRIC RATING
98th/ 347
METRIC RANK
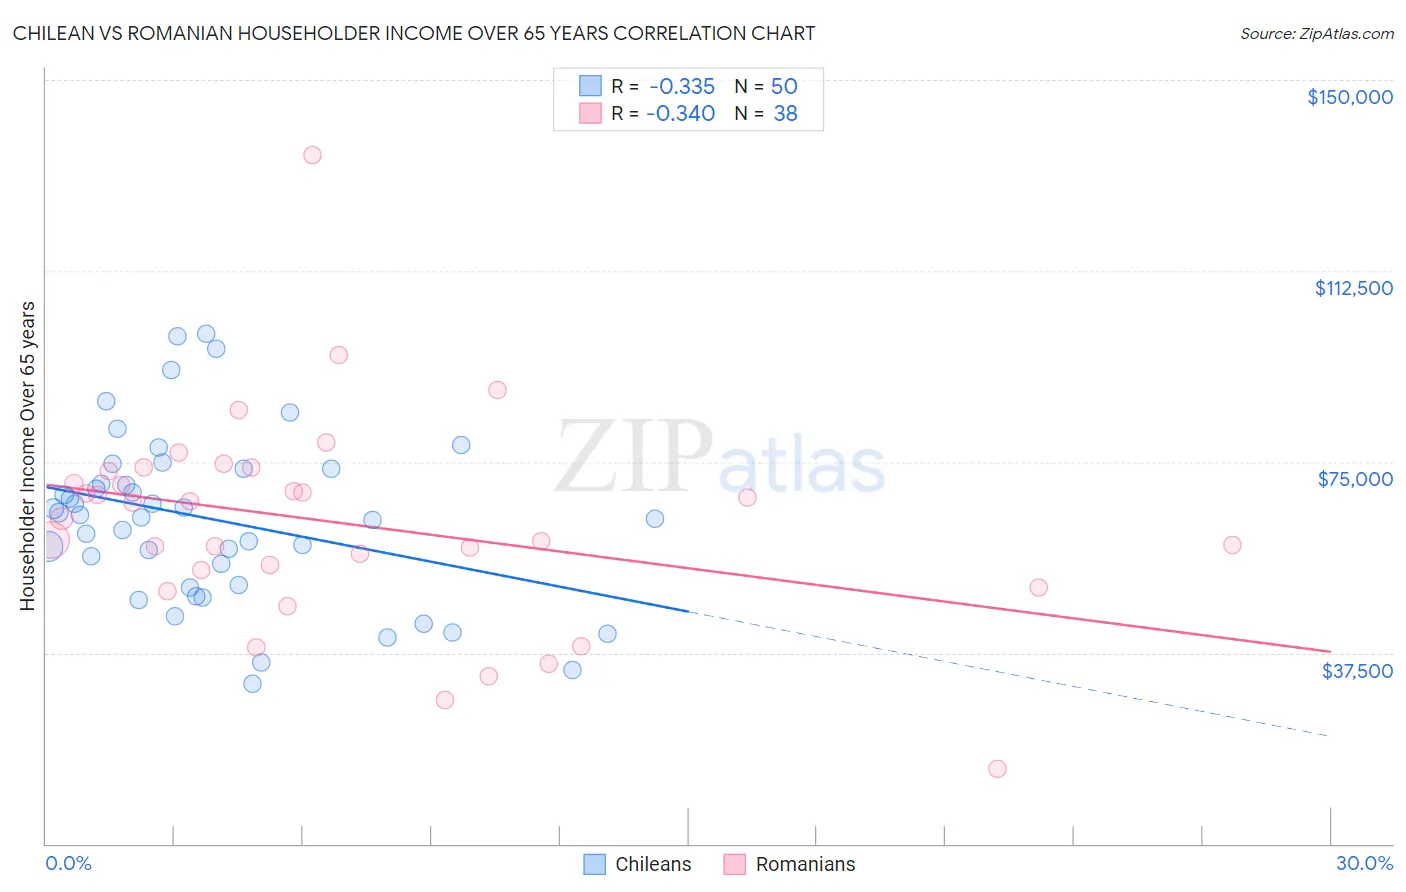
Chilean vs Romanian Householder Income Over 65 years Correlation Chart
The statistical analysis conducted on geographies consisting of 256,269,150 people shows a mild negative correlation between the proportion of Chileans and household income with householder over the age of 65 in the United States with a correlation coefficient (R) of -0.335 and weighted average of $63,957. Similarly, the statistical analysis conducted on geographies consisting of 376,856,051 people shows a mild negative correlation between the proportion of Romanians and household income with householder over the age of 65 in the United States with a correlation coefficient (R) of -0.340 and weighted average of $64,142, a difference of 0.29%.
Householder Income Over 65 years Correlation Summary
| Measurement | Chilean | Romanian |
| Minimum | $31,406 | $14,625 |
| Maximum | $100,074 | $135,238 |
| Range | $68,668 | $120,613 |
| Mean | $63,656 | $62,942 |
| Median | $64,293 | $65,425 |
| Interquartile 25% (IQ1) | $50,804 | $53,666 |
| Interquartile 75% (IQ3) | $73,549 | $73,079 |
| Interquartile Range (IQR) | $22,745 | $19,413 |
| Standard Deviation (Sample) | $16,501 | $20,808 |
| Standard Deviation (Population) | $16,335 | $20,532 |
Demographics Similar to Chileans and Romanians by Householder Income Over 65 years
In terms of householder income over 65 years, the demographic groups most similar to Chileans are British ($63,940, a difference of 0.030%), Immigrants from Cameroon ($63,907, a difference of 0.080%), Italian ($63,885, a difference of 0.11%), Immigrants from Argentina ($63,885, a difference of 0.11%), and Immigrants from Italy ($64,065, a difference of 0.17%). Similarly, the demographic groups most similar to Romanians are Assyrian/Chaldean/Syriac ($64,108, a difference of 0.050%), Immigrants from South Eastern Asia ($64,089, a difference of 0.080%), Sri Lankan ($64,201, a difference of 0.090%), Immigrants from Italy ($64,065, a difference of 0.12%), and Immigrants from Hungary ($64,277, a difference of 0.21%).
| Demographics | Rating | Rank | Householder Income Over 65 years |
| Immigrants | Kuwait | 97.4 /100 | #90 | Exceptional $64,433 |
| Immigrants | Oceania | 97.4 /100 | #91 | Exceptional $64,416 |
| Immigrants | Bulgaria | 97.3 /100 | #92 | Exceptional $64,379 |
| Jordanians | 97.1 /100 | #93 | Exceptional $64,313 |
| Immigrants | Egypt | 97.0 /100 | #94 | Exceptional $64,299 |
| Immigrants | Latvia | 97.0 /100 | #95 | Exceptional $64,298 |
| Immigrants | Hungary | 97.0 /100 | #96 | Exceptional $64,277 |
| Sri Lankans | 96.7 /100 | #97 | Exceptional $64,201 |
| Romanians | 96.5 /100 | #98 | Exceptional $64,142 |
| Assyrians/Chaldeans/Syriacs | 96.4 /100 | #99 | Exceptional $64,108 |
| Immigrants | South Eastern Asia | 96.3 /100 | #100 | Exceptional $64,089 |
| Immigrants | Italy | 96.2 /100 | #101 | Exceptional $64,065 |
| Chileans | 95.8 /100 | #102 | Exceptional $63,957 |
| British | 95.7 /100 | #103 | Exceptional $63,940 |
| Immigrants | Cameroon | 95.6 /100 | #104 | Exceptional $63,907 |
| Italians | 95.5 /100 | #105 | Exceptional $63,885 |
| Immigrants | Argentina | 95.5 /100 | #106 | Exceptional $63,885 |
| Pakistanis | 95.3 /100 | #107 | Exceptional $63,844 |
| Palestinians | 95.1 /100 | #108 | Exceptional $63,800 |
| Europeans | 95.0 /100 | #109 | Exceptional $63,779 |
| Immigrants | Zimbabwe | 94.3 /100 | #110 | Exceptional $63,643 |