Tlingit-Haida vs Mexican Unemployment Among Ages 35 to 44 years
COMPARE
Tlingit-Haida
Mexican
Unemployment Among Ages 35 to 44 years
Unemployment Among Ages 35 to 44 years Comparison
Tlingit-Haida
Mexicans
4.3%
UNEMPLOYMENT AMONG AGES 35 TO 44 YEARS
99.5/ 100
METRIC RATING
24th/ 347
METRIC RANK
5.3%
UNEMPLOYMENT AMONG AGES 35 TO 44 YEARS
0.1/ 100
METRIC RATING
259th/ 347
METRIC RANK
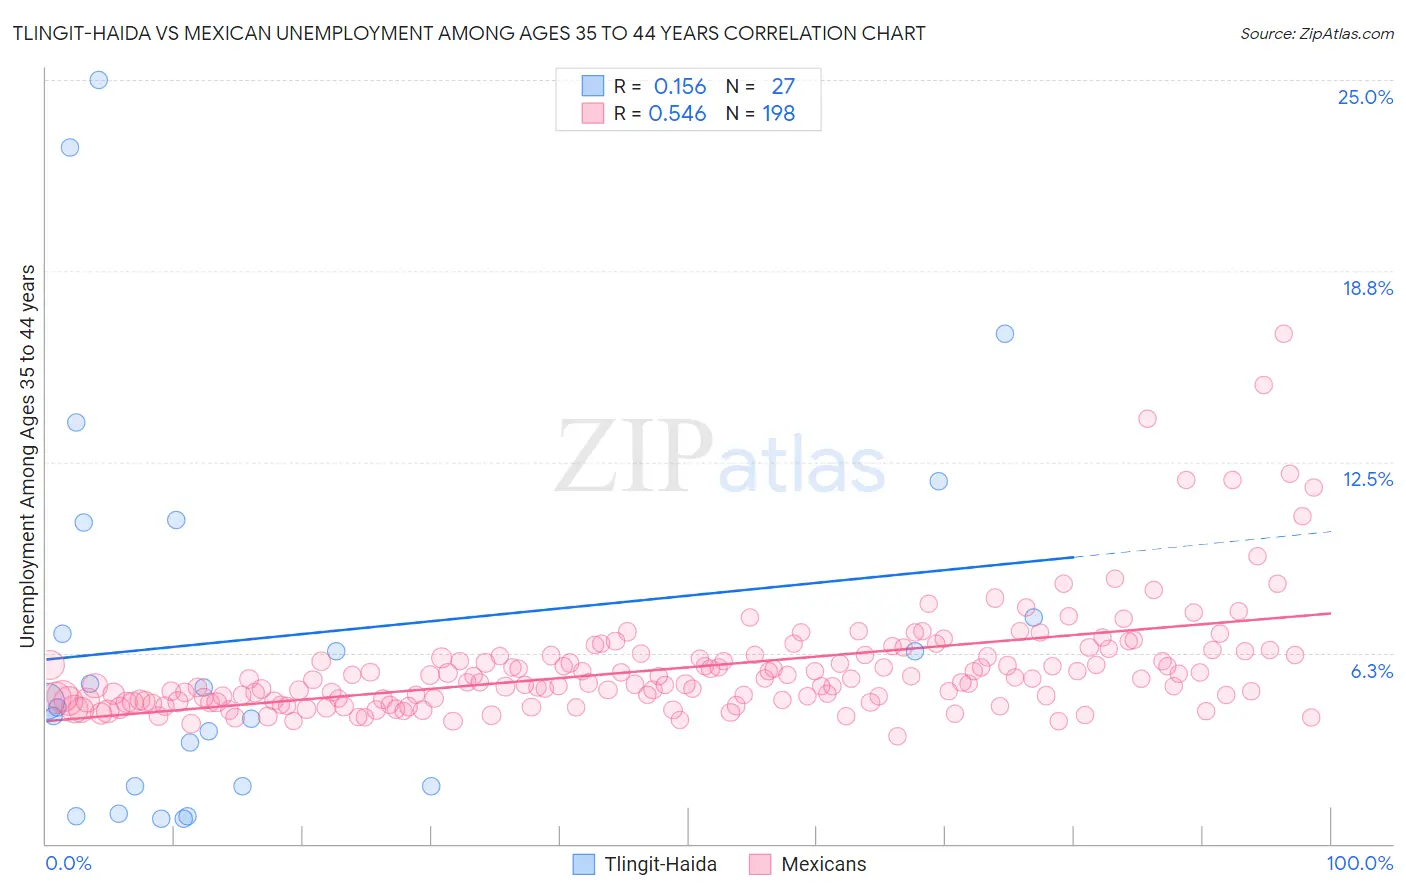
Tlingit-Haida vs Mexican Unemployment Among Ages 35 to 44 years Correlation Chart
The statistical analysis conducted on geographies consisting of 60,489,726 people shows a poor positive correlation between the proportion of Tlingit-Haida and unemployment rate among population between the ages 35 and 44 in the United States with a correlation coefficient (R) of 0.156 and weighted average of 4.3%. Similarly, the statistical analysis conducted on geographies consisting of 530,210,918 people shows a substantial positive correlation between the proportion of Mexicans and unemployment rate among population between the ages 35 and 44 in the United States with a correlation coefficient (R) of 0.546 and weighted average of 5.3%, a difference of 23.8%.
Unemployment Among Ages 35 to 44 years Correlation Summary
| Measurement | Tlingit-Haida | Mexican |
| Minimum | 0.80% | 3.5% |
| Maximum | 25.0% | 16.7% |
| Range | 24.2% | 13.2% |
| Mean | 6.8% | 5.8% |
| Median | 4.7% | 5.3% |
| Interquartile 25% (IQ1) | 1.9% | 4.7% |
| Interquartile 75% (IQ3) | 10.5% | 6.2% |
| Interquartile Range (IQR) | 8.6% | 1.5% |
| Standard Deviation (Sample) | 6.5% | 1.9% |
| Standard Deviation (Population) | 6.3% | 1.8% |
Similar Demographics by Unemployment Among Ages 35 to 44 years
Demographics Similar to Tlingit-Haida by Unemployment Among Ages 35 to 44 years
In terms of unemployment among ages 35 to 44 years, the demographic groups most similar to Tlingit-Haida are Immigrants from Kuwait (4.3%, a difference of 0.010%), Scandinavian (4.2%, a difference of 0.16%), Paraguayan (4.2%, a difference of 0.42%), Bulgarian (4.3%, a difference of 0.47%), and Turkish (4.3%, a difference of 0.53%).
| Demographics | Rating | Rank | Unemployment Among Ages 35 to 44 years |
| Swedes | 99.8 /100 | #17 | Exceptional 4.2% |
| Latvians | 99.8 /100 | #18 | Exceptional 4.2% |
| Immigrants | Nepal | 99.7 /100 | #19 | Exceptional 4.2% |
| Immigrants | Bolivia | 99.7 /100 | #20 | Exceptional 4.2% |
| Paraguayans | 99.6 /100 | #21 | Exceptional 4.2% |
| Scandinavians | 99.5 /100 | #22 | Exceptional 4.2% |
| Immigrants | Kuwait | 99.5 /100 | #23 | Exceptional 4.3% |
| Tlingit-Haida | 99.5 /100 | #24 | Exceptional 4.3% |
| Bulgarians | 99.3 /100 | #25 | Exceptional 4.3% |
| Turks | 99.3 /100 | #26 | Exceptional 4.3% |
| Assyrians/Chaldeans/Syriacs | 99.3 /100 | #27 | Exceptional 4.3% |
| Immigrants | Japan | 99.3 /100 | #28 | Exceptional 4.3% |
| Europeans | 99.2 /100 | #29 | Exceptional 4.3% |
| Immigrants | Pakistan | 99.2 /100 | #30 | Exceptional 4.3% |
| Carpatho Rusyns | 99.2 /100 | #31 | Exceptional 4.3% |
Demographics Similar to Mexicans by Unemployment Among Ages 35 to 44 years
In terms of unemployment among ages 35 to 44 years, the demographic groups most similar to Mexicans are Subsaharan African (5.3%, a difference of 0.030%), Immigrants from Latin America (5.3%, a difference of 0.090%), Immigrants from Fiji (5.3%, a difference of 0.21%), Spanish American (5.3%, a difference of 0.23%), and Seminole (5.2%, a difference of 0.50%).
| Demographics | Rating | Rank | Unemployment Among Ages 35 to 44 years |
| Armenians | 0.2 /100 | #252 | Tragic 5.2% |
| Mexican American Indians | 0.2 /100 | #253 | Tragic 5.2% |
| Immigrants | Bahamas | 0.2 /100 | #254 | Tragic 5.2% |
| Cherokee | 0.2 /100 | #255 | Tragic 5.2% |
| Seminole | 0.1 /100 | #256 | Tragic 5.2% |
| Immigrants | Fiji | 0.1 /100 | #257 | Tragic 5.3% |
| Immigrants | Latin America | 0.1 /100 | #258 | Tragic 5.3% |
| Mexicans | 0.1 /100 | #259 | Tragic 5.3% |
| Sub-Saharan Africans | 0.1 /100 | #260 | Tragic 5.3% |
| Spanish Americans | 0.1 /100 | #261 | Tragic 5.3% |
| Immigrants | Central America | 0.1 /100 | #262 | Tragic 5.3% |
| Choctaw | 0.1 /100 | #263 | Tragic 5.3% |
| Ghanaians | 0.1 /100 | #264 | Tragic 5.3% |
| Yaqui | 0.1 /100 | #265 | Tragic 5.3% |
| Immigrants | Bangladesh | 0.1 /100 | #266 | Tragic 5.3% |