Immigrants from Latin America vs Mexican Householder Income Over 65 years
COMPARE
Immigrants from Latin America
Mexican
Householder Income Over 65 years
Householder Income Over 65 years Comparison
Immigrants from Latin America
Mexicans
$53,265
HOUSEHOLDER INCOME OVER 65 YEARS
0.0/ 100
METRIC RATING
297th/ 347
METRIC RANK
$53,897
HOUSEHOLDER INCOME OVER 65 YEARS
0.1/ 100
METRIC RATING
285th/ 347
METRIC RANK
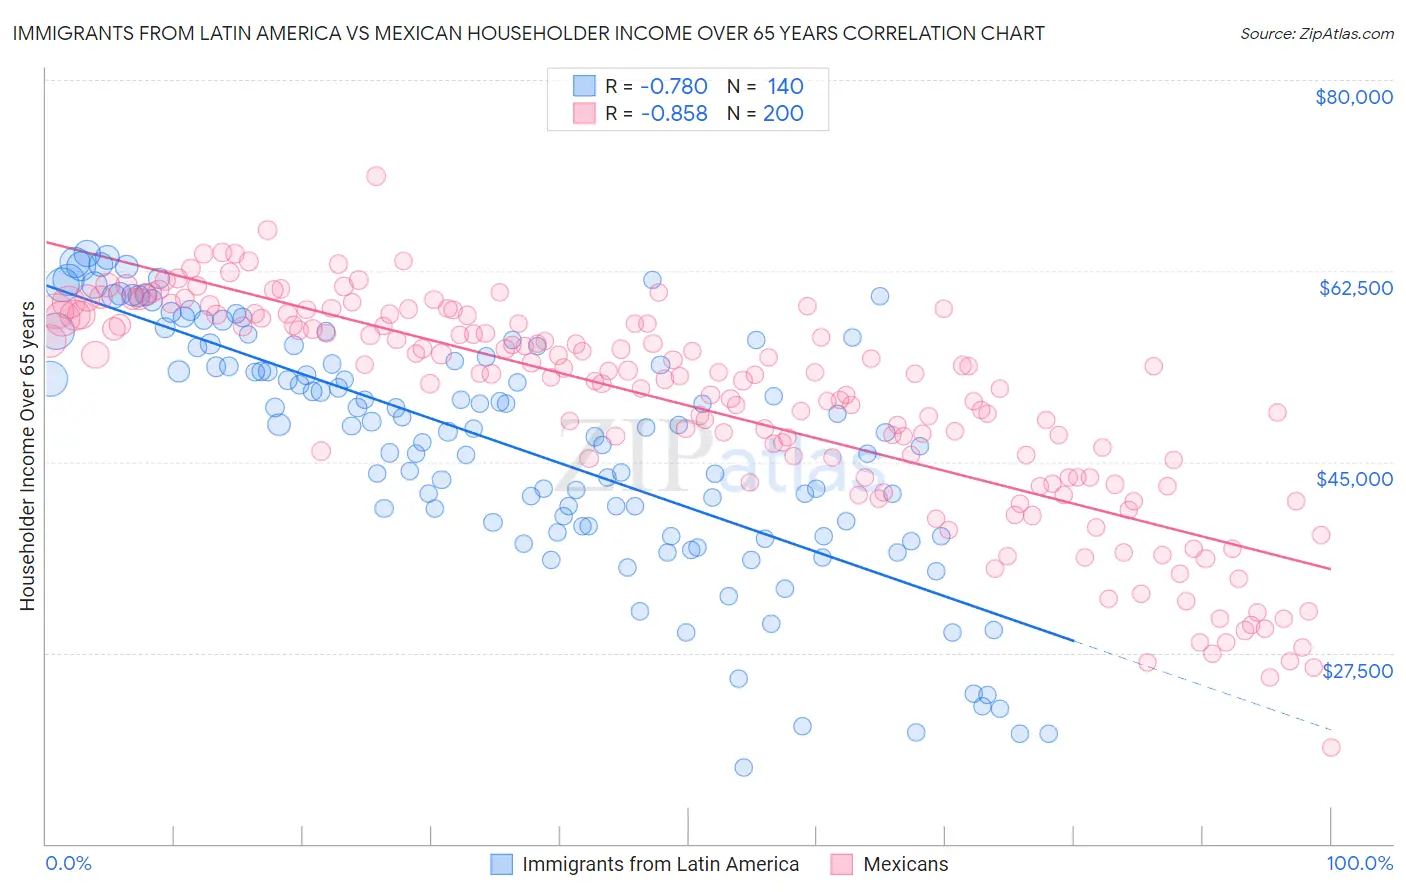
Immigrants from Latin America vs Mexican Householder Income Over 65 years Correlation Chart
The statistical analysis conducted on geographies consisting of 553,755,892 people shows a strong negative correlation between the proportion of Immigrants from Latin America and household income with householder over the age of 65 in the United States with a correlation coefficient (R) of -0.780 and weighted average of $53,265. Similarly, the statistical analysis conducted on geographies consisting of 559,960,320 people shows a very strong negative correlation between the proportion of Mexicans and household income with householder over the age of 65 in the United States with a correlation coefficient (R) of -0.858 and weighted average of $53,897, a difference of 1.2%.
Householder Income Over 65 years Correlation Summary
| Measurement | Immigrants from Latin America | Mexican |
| Minimum | $17,032 | $18,818 |
| Maximum | $64,104 | $71,178 |
| Range | $47,072 | $52,360 |
| Mean | $46,627 | $50,150 |
| Median | $48,328 | $52,997 |
| Interquartile 25% (IQ1) | $39,297 | $43,543 |
| Interquartile 75% (IQ3) | $55,581 | $58,155 |
| Interquartile Range (IQR) | $16,283 | $14,612 |
| Standard Deviation (Sample) | $11,143 | $10,117 |
| Standard Deviation (Population) | $11,104 | $10,091 |
Demographics Similar to Immigrants from Latin America and Mexicans by Householder Income Over 65 years
In terms of householder income over 65 years, the demographic groups most similar to Immigrants from Latin America are Central American Indian ($53,232, a difference of 0.060%), Ottawa ($53,217, a difference of 0.090%), Immigrants from Somalia ($53,333, a difference of 0.13%), Immigrants from Bahamas ($53,174, a difference of 0.17%), and Immigrants from Central America ($53,420, a difference of 0.29%). Similarly, the demographic groups most similar to Mexicans are Chippewa ($53,847, a difference of 0.090%), Immigrants from Guatemala ($53,950, a difference of 0.10%), Immigrants from Liberia ($53,967, a difference of 0.13%), Immigrants from Armenia ($53,974, a difference of 0.14%), and Somali ($54,004, a difference of 0.20%).
| Demographics | Rating | Rank | Householder Income Over 65 years |
| Somalis | 0.1 /100 | #281 | Tragic $54,004 |
| Immigrants | Armenia | 0.1 /100 | #282 | Tragic $53,974 |
| Immigrants | Liberia | 0.1 /100 | #283 | Tragic $53,967 |
| Immigrants | Guatemala | 0.1 /100 | #284 | Tragic $53,950 |
| Mexicans | 0.1 /100 | #285 | Tragic $53,897 |
| Chippewa | 0.1 /100 | #286 | Tragic $53,847 |
| Immigrants | Barbados | 0.1 /100 | #287 | Tragic $53,766 |
| Paiute | 0.1 /100 | #288 | Tragic $53,762 |
| Iroquois | 0.1 /100 | #289 | Tragic $53,737 |
| Chickasaw | 0.1 /100 | #290 | Tragic $53,732 |
| Africans | 0.0 /100 | #291 | Tragic $53,711 |
| Shoshone | 0.0 /100 | #292 | Tragic $53,681 |
| Immigrants | Belize | 0.0 /100 | #293 | Tragic $53,665 |
| Senegalese | 0.0 /100 | #294 | Tragic $53,591 |
| Immigrants | Central America | 0.0 /100 | #295 | Tragic $53,420 |
| Immigrants | Somalia | 0.0 /100 | #296 | Tragic $53,333 |
| Immigrants | Latin America | 0.0 /100 | #297 | Tragic $53,265 |
| Central American Indians | 0.0 /100 | #298 | Tragic $53,232 |
| Ottawa | 0.0 /100 | #299 | Tragic $53,217 |
| Immigrants | Bahamas | 0.0 /100 | #300 | Tragic $53,174 |
| Yuman | 0.0 /100 | #301 | Tragic $53,110 |