Tlingit-Haida vs Filipino Median Female Earnings
COMPARE
Tlingit-Haida
Filipino
Median Female Earnings
Median Female Earnings Comparison
Tlingit-Haida
Filipinos
$39,513
MEDIAN FEMALE EARNINGS
40.5/ 100
METRIC RATING
182nd/ 347
METRIC RANK
$49,508
MEDIAN FEMALE EARNINGS
100.0/ 100
METRIC RATING
2nd/ 347
METRIC RANK
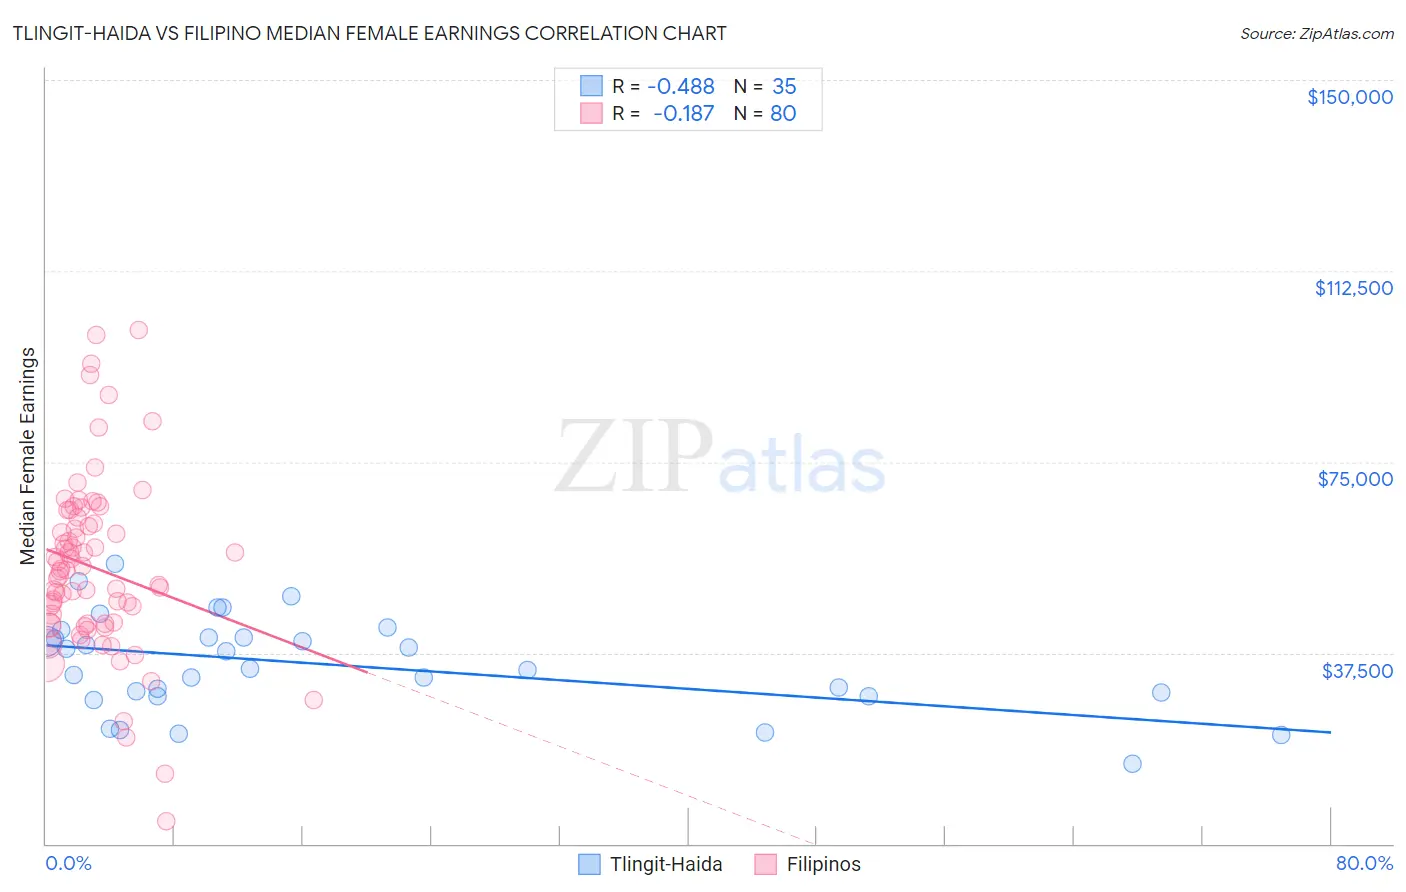
Tlingit-Haida vs Filipino Median Female Earnings Correlation Chart
The statistical analysis conducted on geographies consisting of 60,850,593 people shows a moderate negative correlation between the proportion of Tlingit-Haida and median female earnings in the United States with a correlation coefficient (R) of -0.488 and weighted average of $39,513. Similarly, the statistical analysis conducted on geographies consisting of 254,323,298 people shows a poor negative correlation between the proportion of Filipinos and median female earnings in the United States with a correlation coefficient (R) of -0.187 and weighted average of $49,508, a difference of 25.3%.
Median Female Earnings Correlation Summary
| Measurement | Tlingit-Haida | Filipino |
| Minimum | $15,833 | $4,500 |
| Maximum | $55,000 | $100,821 |
| Range | $39,167 | $96,321 |
| Mean | $35,190 | $54,231 |
| Median | $34,397 | $53,668 |
| Interquartile 25% (IQ1) | $28,977 | $43,160 |
| Interquartile 75% (IQ3) | $40,590 | $63,449 |
| Interquartile Range (IQR) | $11,613 | $20,289 |
| Standard Deviation (Sample) | $9,336 | $17,351 |
| Standard Deviation (Population) | $9,202 | $17,242 |
Similar Demographics by Median Female Earnings
Demographics Similar to Tlingit-Haida by Median Female Earnings
In terms of median female earnings, the demographic groups most similar to Tlingit-Haida are Hungarian ($39,510, a difference of 0.010%), Tsimshian ($39,530, a difference of 0.050%), Immigrants from Kenya ($39,535, a difference of 0.060%), European ($39,457, a difference of 0.14%), and Immigrants from West Indies ($39,441, a difference of 0.18%).
| Demographics | Rating | Rank | Median Female Earnings |
| Immigrants | South America | 47.2 /100 | #175 | Average $39,643 |
| Nigerians | 47.0 /100 | #176 | Average $39,641 |
| Costa Ricans | 46.1 /100 | #177 | Average $39,622 |
| Slavs | 45.6 /100 | #178 | Average $39,613 |
| Immigrants | Germany | 45.1 /100 | #179 | Average $39,603 |
| Immigrants | Kenya | 41.6 /100 | #180 | Average $39,535 |
| Tsimshian | 41.4 /100 | #181 | Average $39,530 |
| Tlingit-Haida | 40.5 /100 | #182 | Average $39,513 |
| Hungarians | 40.3 /100 | #183 | Average $39,510 |
| Europeans | 37.7 /100 | #184 | Fair $39,457 |
| Immigrants | West Indies | 36.9 /100 | #185 | Fair $39,441 |
| Colombians | 36.9 /100 | #186 | Fair $39,439 |
| Swedes | 36.0 /100 | #187 | Fair $39,421 |
| Bermudans | 35.9 /100 | #188 | Fair $39,418 |
| Senegalese | 34.2 /100 | #189 | Fair $39,384 |
Demographics Similar to Filipinos by Median Female Earnings
In terms of median female earnings, the demographic groups most similar to Filipinos are Immigrants from Taiwan ($49,256, a difference of 0.51%), Immigrants from Hong Kong ($49,818, a difference of 0.63%), Immigrants from India ($48,292, a difference of 2.5%), Immigrants from Singapore ($47,986, a difference of 3.2%), and Immigrants from Ireland ($47,598, a difference of 4.0%).
| Demographics | Rating | Rank | Median Female Earnings |
| Immigrants | Hong Kong | 100.0 /100 | #1 | Exceptional $49,818 |
| Filipinos | 100.0 /100 | #2 | Exceptional $49,508 |
| Immigrants | Taiwan | 100.0 /100 | #3 | Exceptional $49,256 |
| Immigrants | India | 100.0 /100 | #4 | Exceptional $48,292 |
| Immigrants | Singapore | 100.0 /100 | #5 | Exceptional $47,986 |
| Immigrants | Ireland | 100.0 /100 | #6 | Exceptional $47,598 |
| Thais | 100.0 /100 | #7 | Exceptional $47,577 |
| Iranians | 100.0 /100 | #8 | Exceptional $47,421 |
| Immigrants | Iran | 100.0 /100 | #9 | Exceptional $47,154 |
| Immigrants | China | 100.0 /100 | #10 | Exceptional $46,972 |
| Okinawans | 100.0 /100 | #11 | Exceptional $46,905 |
| Immigrants | Israel | 100.0 /100 | #12 | Exceptional $46,902 |
| Immigrants | Australia | 100.0 /100 | #13 | Exceptional $46,573 |
| Soviet Union | 100.0 /100 | #14 | Exceptional $46,556 |
| Immigrants | Eastern Asia | 100.0 /100 | #15 | Exceptional $46,502 |