Tlingit-Haida vs Immigrants from Netherlands 4 or more Vehicles in Household
COMPARE
Tlingit-Haida
Immigrants from Netherlands
4 or more Vehicles in Household
4 or more Vehicles in Household Comparison
Tlingit-Haida
Immigrants from Netherlands
6.8%
4 OR MORE VEHICLES IN HOUSEHOLD
96.2/ 100
METRIC RATING
115th/ 347
METRIC RANK
6.6%
4 OR MORE VEHICLES IN HOUSEHOLD
87.8/ 100
METRIC RATING
132nd/ 347
METRIC RANK
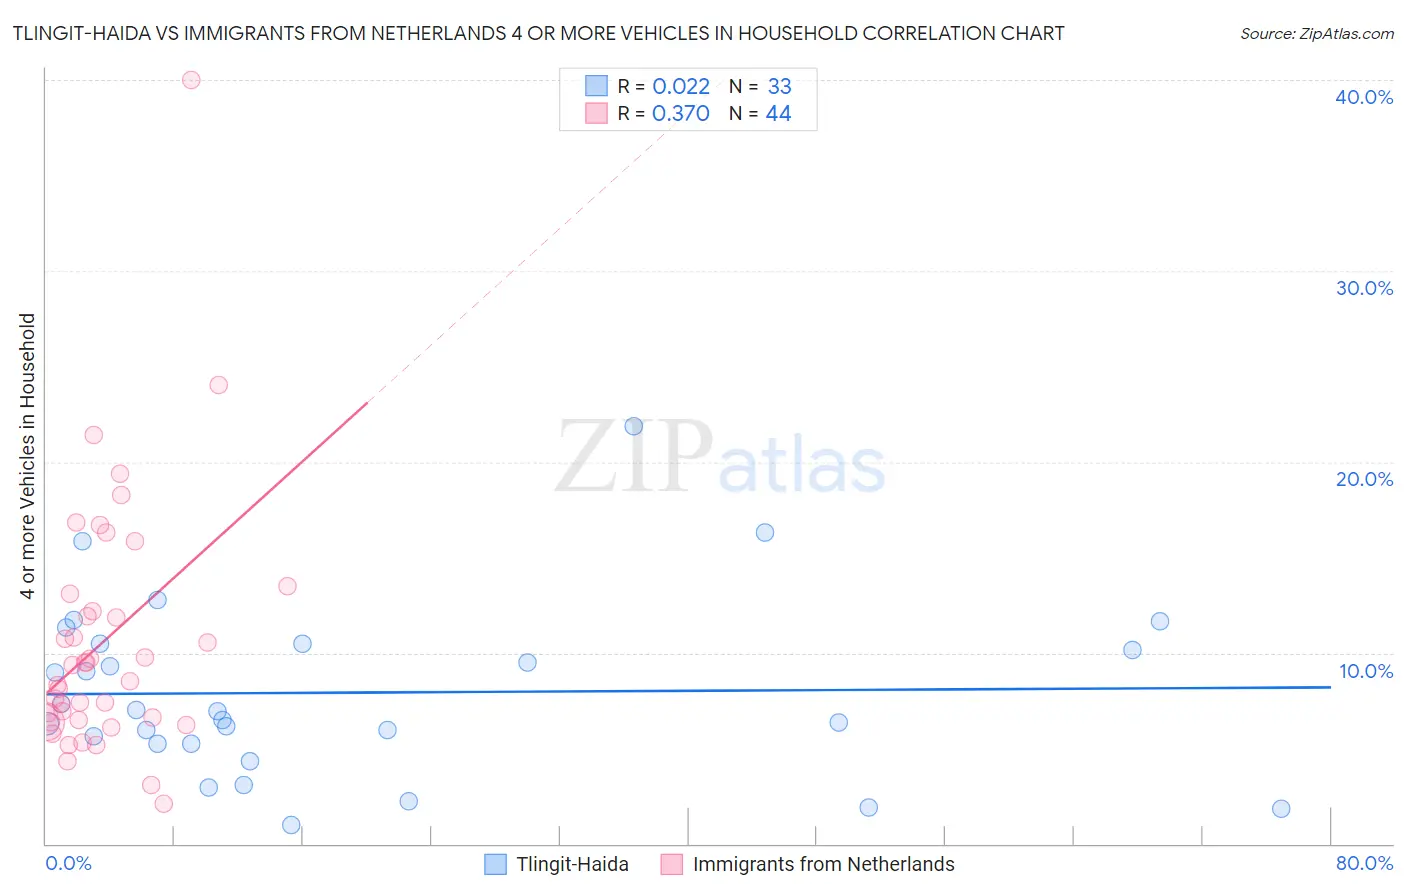
Tlingit-Haida vs Immigrants from Netherlands 4 or more Vehicles in Household Correlation Chart
The statistical analysis conducted on geographies consisting of 60,810,933 people shows no correlation between the proportion of Tlingit-Haida and percentage of households with 4 or more vehicles available in the United States with a correlation coefficient (R) of 0.022 and weighted average of 6.8%. Similarly, the statistical analysis conducted on geographies consisting of 237,226,549 people shows a mild positive correlation between the proportion of Immigrants from Netherlands and percentage of households with 4 or more vehicles available in the United States with a correlation coefficient (R) of 0.370 and weighted average of 6.6%, a difference of 3.0%.
4 or more Vehicles in Household Correlation Summary
| Measurement | Tlingit-Haida | Immigrants from Netherlands |
| Minimum | 0.99% | 2.1% |
| Maximum | 21.9% | 40.0% |
| Range | 20.9% | 37.9% |
| Mean | 7.9% | 10.6% |
| Median | 6.9% | 8.9% |
| Interquartile 25% (IQ1) | 5.3% | 6.4% |
| Interquartile 75% (IQ3) | 10.5% | 12.6% |
| Interquartile Range (IQR) | 5.2% | 6.2% |
| Standard Deviation (Sample) | 4.6% | 6.7% |
| Standard Deviation (Population) | 4.5% | 6.6% |
Demographics Similar to Tlingit-Haida and Immigrants from Netherlands by 4 or more Vehicles in Household
In terms of 4 or more vehicles in household, the demographic groups most similar to Tlingit-Haida are Bolivian (6.8%, a difference of 0.060%), Canadian (6.9%, a difference of 0.11%), Immigrants from Guatemala (6.8%, a difference of 0.26%), Burmese (6.8%, a difference of 0.28%), and French American Indian (6.8%, a difference of 0.28%). Similarly, the demographic groups most similar to Immigrants from Netherlands are Maltese (6.7%, a difference of 0.14%), Armenian (6.6%, a difference of 0.19%), Immigrants from Scotland (6.7%, a difference of 0.29%), Immigrants from England (6.7%, a difference of 1.1%), and Immigrants from Bolivia (6.7%, a difference of 1.3%).
| Demographics | Rating | Rank | 4 or more Vehicles in Household |
| Canadians | 96.4 /100 | #113 | Exceptional 6.9% |
| Bolivians | 96.3 /100 | #114 | Exceptional 6.8% |
| Tlingit-Haida | 96.2 /100 | #115 | Exceptional 6.8% |
| Immigrants | Guatemala | 95.8 /100 | #116 | Exceptional 6.8% |
| Burmese | 95.7 /100 | #117 | Exceptional 6.8% |
| French American Indians | 95.7 /100 | #118 | Exceptional 6.8% |
| Costa Ricans | 95.5 /100 | #119 | Exceptional 6.8% |
| Comanche | 94.8 /100 | #120 | Exceptional 6.8% |
| Immigrants | Germany | 94.7 /100 | #121 | Exceptional 6.8% |
| Immigrants | Nicaragua | 94.7 /100 | #122 | Exceptional 6.8% |
| Immigrants | Immigrants | 94.6 /100 | #123 | Exceptional 6.8% |
| Immigrants | Asia | 94.4 /100 | #124 | Exceptional 6.8% |
| Austrians | 94.1 /100 | #125 | Exceptional 6.8% |
| Belgians | 94.1 /100 | #126 | Exceptional 6.8% |
| Immigrants | Korea | 93.8 /100 | #127 | Exceptional 6.8% |
| Immigrants | Bolivia | 92.5 /100 | #128 | Exceptional 6.7% |
| Immigrants | England | 92.0 /100 | #129 | Exceptional 6.7% |
| Immigrants | Scotland | 89.0 /100 | #130 | Excellent 6.7% |
| Maltese | 88.4 /100 | #131 | Excellent 6.7% |
| Immigrants | Netherlands | 87.8 /100 | #132 | Excellent 6.6% |
| Armenians | 86.9 /100 | #133 | Excellent 6.6% |