Immigrants from Congo vs Immigrants from Belarus Householder Income Over 65 years
COMPARE
Immigrants from Congo
Immigrants from Belarus
Householder Income Over 65 years
Householder Income Over 65 years Comparison
Immigrants from Congo
Immigrants from Belarus
$51,393
HOUSEHOLDER INCOME OVER 65 YEARS
0.0/ 100
METRIC RATING
324th/ 347
METRIC RANK
$62,162
HOUSEHOLDER INCOME OVER 65 YEARS
77.8/ 100
METRIC RATING
143rd/ 347
METRIC RANK
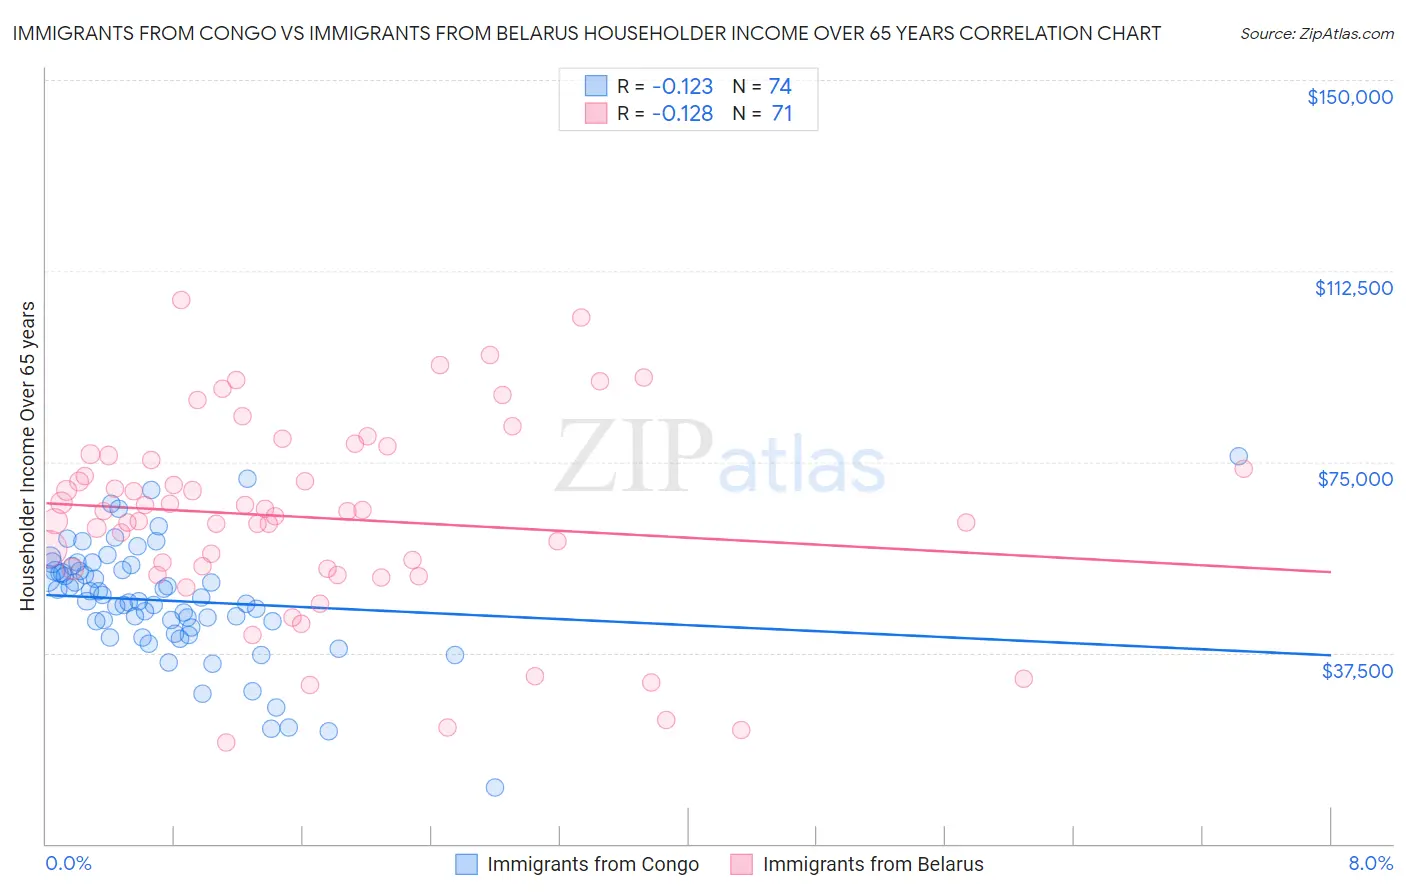
Immigrants from Congo vs Immigrants from Belarus Householder Income Over 65 years Correlation Chart
The statistical analysis conducted on geographies consisting of 92,030,146 people shows a poor negative correlation between the proportion of Immigrants from Congo and household income with householder over the age of 65 in the United States with a correlation coefficient (R) of -0.123 and weighted average of $51,393. Similarly, the statistical analysis conducted on geographies consisting of 150,124,953 people shows a poor negative correlation between the proportion of Immigrants from Belarus and household income with householder over the age of 65 in the United States with a correlation coefficient (R) of -0.128 and weighted average of $62,162, a difference of 20.9%.
Householder Income Over 65 years Correlation Summary
| Measurement | Immigrants from Congo | Immigrants from Belarus |
| Minimum | $11,111 | $19,854 |
| Maximum | $76,000 | $106,741 |
| Range | $64,889 | $86,887 |
| Mean | $47,689 | $64,012 |
| Median | $48,011 | $65,250 |
| Interquartile 25% (IQ1) | $42,512 | $53,983 |
| Interquartile 75% (IQ3) | $53,762 | $76,256 |
| Interquartile Range (IQR) | $11,250 | $22,273 |
| Standard Deviation (Sample) | $11,475 | $19,180 |
| Standard Deviation (Population) | $11,397 | $19,044 |
Similar Demographics by Householder Income Over 65 years
Demographics Similar to Immigrants from Congo by Householder Income Over 65 years
In terms of householder income over 65 years, the demographic groups most similar to Immigrants from Congo are Cajun ($51,397, a difference of 0.010%), British West Indian ($51,463, a difference of 0.13%), Immigrants from Haiti ($51,219, a difference of 0.34%), Kiowa ($51,140, a difference of 0.49%), and Menominee ($51,719, a difference of 0.63%).
| Demographics | Rating | Rank | Householder Income Over 65 years |
| Immigrants | St. Vincent and the Grenadines | 0.0 /100 | #317 | Tragic $51,922 |
| Haitians | 0.0 /100 | #318 | Tragic $51,912 |
| Immigrants | Honduras | 0.0 /100 | #319 | Tragic $51,888 |
| Colville | 0.0 /100 | #320 | Tragic $51,739 |
| Menominee | 0.0 /100 | #321 | Tragic $51,719 |
| British West Indians | 0.0 /100 | #322 | Tragic $51,463 |
| Cajuns | 0.0 /100 | #323 | Tragic $51,397 |
| Immigrants | Congo | 0.0 /100 | #324 | Tragic $51,393 |
| Immigrants | Haiti | 0.0 /100 | #325 | Tragic $51,219 |
| Kiowa | 0.0 /100 | #326 | Tragic $51,140 |
| Bahamians | 0.0 /100 | #327 | Tragic $51,000 |
| Hopi | 0.0 /100 | #328 | Tragic $50,925 |
| Blacks/African Americans | 0.0 /100 | #329 | Tragic $50,779 |
| Immigrants | Grenada | 0.0 /100 | #330 | Tragic $50,747 |
| Pima | 0.0 /100 | #331 | Tragic $50,539 |
Demographics Similar to Immigrants from Belarus by Householder Income Over 65 years
In terms of householder income over 65 years, the demographic groups most similar to Immigrants from Belarus are South American Indian ($62,215, a difference of 0.090%), Canadian ($62,230, a difference of 0.11%), Arab ($62,266, a difference of 0.17%), Lebanese ($62,287, a difference of 0.20%), and Immigrants from Kazakhstan ($62,292, a difference of 0.21%).
| Demographics | Rating | Rank | Householder Income Over 65 years |
| Alaskan Athabascans | 80.6 /100 | #136 | Excellent $62,330 |
| Immigrants | Syria | 80.2 /100 | #137 | Excellent $62,303 |
| Immigrants | Kazakhstan | 80.0 /100 | #138 | Excellent $62,292 |
| Lebanese | 79.9 /100 | #139 | Good $62,287 |
| Arabs | 79.6 /100 | #140 | Good $62,266 |
| Canadians | 79.0 /100 | #141 | Good $62,230 |
| South American Indians | 78.7 /100 | #142 | Good $62,215 |
| Immigrants | Belarus | 77.8 /100 | #143 | Good $62,162 |
| Immigrants | Peru | 74.4 /100 | #144 | Good $61,988 |
| Immigrants | Uganda | 74.2 /100 | #145 | Good $61,976 |
| Immigrants | Southern Europe | 72.7 /100 | #146 | Good $61,902 |
| Immigrants | Nepal | 71.4 /100 | #147 | Good $61,843 |
| Alsatians | 70.5 /100 | #148 | Good $61,797 |
| Scottish | 69.1 /100 | #149 | Good $61,735 |
| Slavs | 68.5 /100 | #150 | Good $61,709 |