Paiute vs Hungarian Householder Income Under 25 years
COMPARE
Paiute
Hungarian
Householder Income Under 25 years
Householder Income Under 25 years Comparison
Paiute
Hungarians
$51,743
HOUSEHOLDER INCOME UNDER 25 YEARS
25.1/ 100
METRIC RATING
184th/ 347
METRIC RANK
$50,247
HOUSEHOLDER INCOME UNDER 25 YEARS
0.9/ 100
METRIC RATING
261st/ 347
METRIC RANK
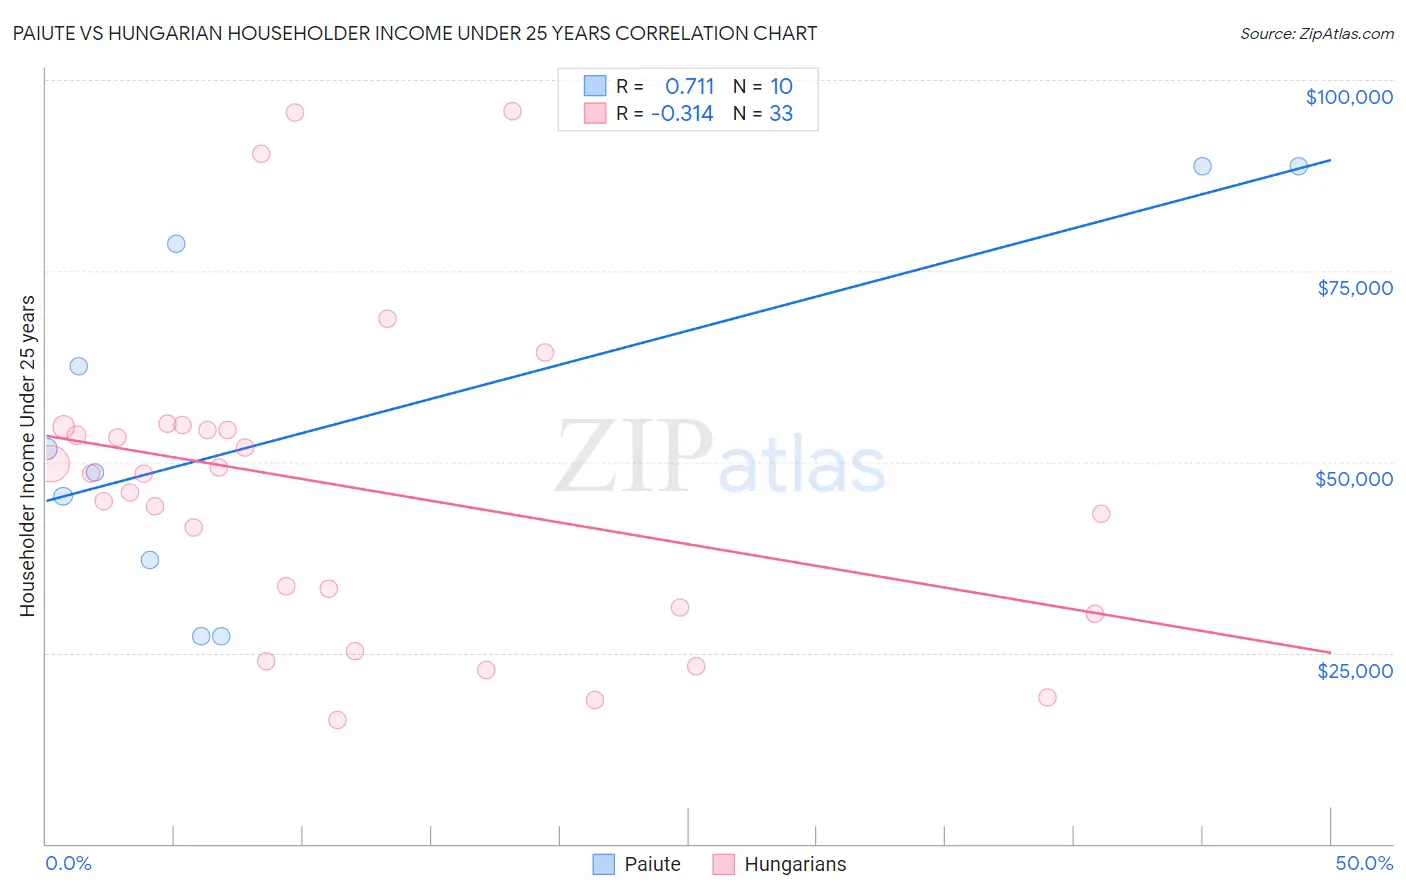
Paiute vs Hungarian Householder Income Under 25 years Correlation Chart
The statistical analysis conducted on geographies consisting of 55,798,660 people shows a strong positive correlation between the proportion of Paiute and household income with householder under the age of 25 in the United States with a correlation coefficient (R) of 0.711 and weighted average of $51,743. Similarly, the statistical analysis conducted on geographies consisting of 392,087,148 people shows a mild negative correlation between the proportion of Hungarians and household income with householder under the age of 25 in the United States with a correlation coefficient (R) of -0.314 and weighted average of $50,247, a difference of 3.0%.
Householder Income Under 25 years Correlation Summary
| Measurement | Paiute | Hungarian |
| Minimum | $27,120 | $16,220 |
| Maximum | $88,654 | $95,845 |
| Range | $61,534 | $79,625 |
| Mean | $55,543 | $46,639 |
| Median | $50,117 | $48,413 |
| Interquartile 25% (IQ1) | $37,118 | $30,495 |
| Interquartile 75% (IQ3) | $78,623 | $54,364 |
| Interquartile Range (IQR) | $41,505 | $23,869 |
| Standard Deviation (Sample) | $23,320 | $20,516 |
| Standard Deviation (Population) | $22,123 | $20,203 |
Similar Demographics by Householder Income Under 25 years
Demographics Similar to Paiute by Householder Income Under 25 years
In terms of householder income under 25 years, the demographic groups most similar to Paiute are Immigrants from Latvia ($51,737, a difference of 0.010%), Alaskan Athabascan ($51,713, a difference of 0.060%), Immigrants from South Africa ($51,705, a difference of 0.070%), Mexican American Indian ($51,783, a difference of 0.080%), and European ($51,796, a difference of 0.10%).
| Demographics | Rating | Rank | Householder Income Under 25 years |
| British West Indians | 30.0 /100 | #177 | Fair $51,844 |
| Finns | 29.2 /100 | #178 | Fair $51,827 |
| Basques | 28.7 /100 | #179 | Fair $51,818 |
| Immigrants | England | 28.7 /100 | #180 | Fair $51,817 |
| Europeans | 27.6 /100 | #181 | Fair $51,796 |
| Jordanians | 27.6 /100 | #182 | Fair $51,796 |
| Mexican American Indians | 27.0 /100 | #183 | Fair $51,783 |
| Paiute | 25.1 /100 | #184 | Fair $51,743 |
| Immigrants | Latvia | 24.8 /100 | #185 | Fair $51,737 |
| Alaskan Athabascans | 23.8 /100 | #186 | Fair $51,713 |
| Immigrants | South Africa | 23.4 /100 | #187 | Fair $51,705 |
| Northern Europeans | 22.2 /100 | #188 | Fair $51,678 |
| Croatians | 21.6 /100 | #189 | Fair $51,662 |
| Malaysians | 19.7 /100 | #190 | Poor $51,615 |
| Panamanians | 19.5 /100 | #191 | Poor $51,611 |
Demographics Similar to Hungarians by Householder Income Under 25 years
In terms of householder income under 25 years, the demographic groups most similar to Hungarians are Haitian ($50,231, a difference of 0.030%), Hispanic or Latino ($50,279, a difference of 0.060%), Immigrants from Dominican Republic ($50,204, a difference of 0.090%), Immigrants from Dominica ($50,301, a difference of 0.11%), and White/Caucasian ($50,336, a difference of 0.18%).
| Demographics | Rating | Rank | Householder Income Under 25 years |
| Luxembourgers | 1.2 /100 | #254 | Tragic $50,379 |
| Aleuts | 1.2 /100 | #255 | Tragic $50,377 |
| Immigrants | Cuba | 1.2 /100 | #256 | Tragic $50,374 |
| Lebanese | 1.1 /100 | #257 | Tragic $50,355 |
| Whites/Caucasians | 1.1 /100 | #258 | Tragic $50,336 |
| Immigrants | Dominica | 1.0 /100 | #259 | Tragic $50,301 |
| Hispanics or Latinos | 0.9 /100 | #260 | Tragic $50,279 |
| Hungarians | 0.9 /100 | #261 | Tragic $50,247 |
| Haitians | 0.8 /100 | #262 | Tragic $50,231 |
| Immigrants | Dominican Republic | 0.8 /100 | #263 | Tragic $50,204 |
| Fijians | 0.6 /100 | #264 | Tragic $50,132 |
| Belgians | 0.6 /100 | #265 | Tragic $50,113 |
| Immigrants | Venezuela | 0.6 /100 | #266 | Tragic $50,109 |
| Immigrants | Laos | 0.5 /100 | #267 | Tragic $50,041 |
| Venezuelans | 0.5 /100 | #268 | Tragic $50,011 |