Potawatomi vs Hungarian Householder Income Under 25 years
COMPARE
Potawatomi
Hungarian
Householder Income Under 25 years
Householder Income Under 25 years Comparison
Potawatomi
Hungarians
$46,462
HOUSEHOLDER INCOME UNDER 25 YEARS
0.0/ 100
METRIC RATING
321st/ 347
METRIC RANK
$50,247
HOUSEHOLDER INCOME UNDER 25 YEARS
0.9/ 100
METRIC RATING
261st/ 347
METRIC RANK
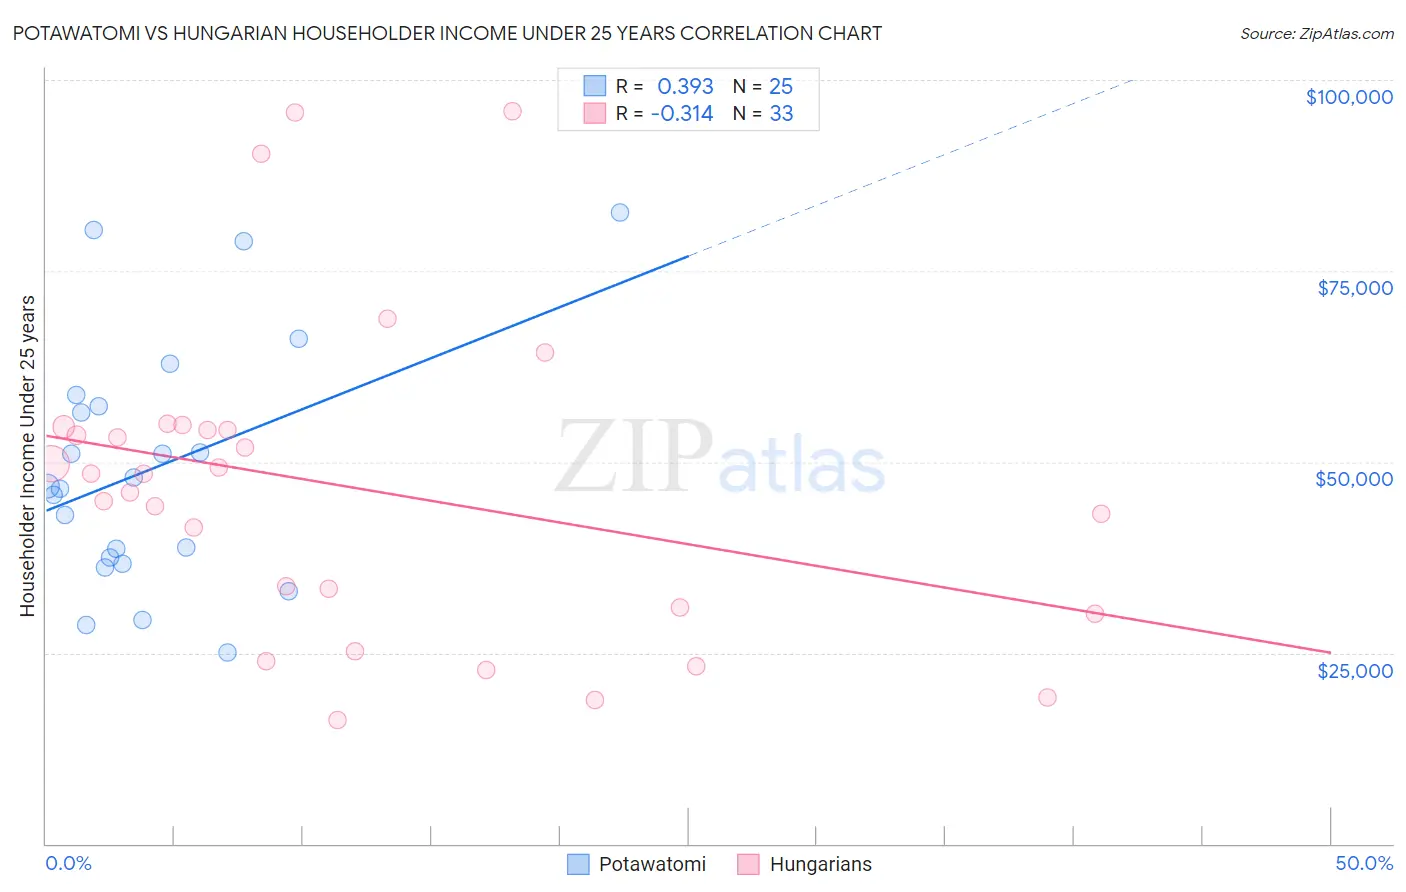
Potawatomi vs Hungarian Householder Income Under 25 years Correlation Chart
The statistical analysis conducted on geographies consisting of 111,079,287 people shows a mild positive correlation between the proportion of Potawatomi and household income with householder under the age of 25 in the United States with a correlation coefficient (R) of 0.393 and weighted average of $46,462. Similarly, the statistical analysis conducted on geographies consisting of 392,087,148 people shows a mild negative correlation between the proportion of Hungarians and household income with householder under the age of 25 in the United States with a correlation coefficient (R) of -0.314 and weighted average of $50,247, a difference of 8.2%.
Householder Income Under 25 years Correlation Summary
| Measurement | Potawatomi | Hungarian |
| Minimum | $25,000 | $16,220 |
| Maximum | $82,708 | $95,845 |
| Range | $57,708 | $79,625 |
| Mean | $49,228 | $46,639 |
| Median | $46,870 | $48,413 |
| Interquartile 25% (IQ1) | $37,131 | $30,495 |
| Interquartile 75% (IQ3) | $57,967 | $54,364 |
| Interquartile Range (IQR) | $20,836 | $23,869 |
| Standard Deviation (Sample) | $15,912 | $20,516 |
| Standard Deviation (Population) | $15,591 | $20,203 |
Similar Demographics by Householder Income Under 25 years
Demographics Similar to Potawatomi by Householder Income Under 25 years
In terms of householder income under 25 years, the demographic groups most similar to Potawatomi are Sioux ($46,417, a difference of 0.10%), Immigrants from Saudi Arabia ($46,187, a difference of 0.60%), Immigrants from Sudan ($46,791, a difference of 0.71%), African ($46,838, a difference of 0.81%), and Spanish American ($46,913, a difference of 0.97%).
| Demographics | Rating | Rank | Householder Income Under 25 years |
| Chippewa | 0.0 /100 | #314 | Tragic $47,015 |
| Crow | 0.0 /100 | #315 | Tragic $47,012 |
| Sudanese | 0.0 /100 | #316 | Tragic $46,982 |
| Hopi | 0.0 /100 | #317 | Tragic $46,978 |
| Spanish Americans | 0.0 /100 | #318 | Tragic $46,913 |
| Africans | 0.0 /100 | #319 | Tragic $46,838 |
| Immigrants | Sudan | 0.0 /100 | #320 | Tragic $46,791 |
| Potawatomi | 0.0 /100 | #321 | Tragic $46,462 |
| Sioux | 0.0 /100 | #322 | Tragic $46,417 |
| Immigrants | Saudi Arabia | 0.0 /100 | #323 | Tragic $46,187 |
| Dutch West Indians | 0.0 /100 | #324 | Tragic $45,816 |
| Immigrants | Bahamas | 0.0 /100 | #325 | Tragic $45,793 |
| Osage | 0.0 /100 | #326 | Tragic $45,764 |
| Bahamians | 0.0 /100 | #327 | Tragic $45,743 |
| German Russians | 0.0 /100 | #328 | Tragic $45,673 |
Demographics Similar to Hungarians by Householder Income Under 25 years
In terms of householder income under 25 years, the demographic groups most similar to Hungarians are Haitian ($50,231, a difference of 0.030%), Hispanic or Latino ($50,279, a difference of 0.060%), Immigrants from Dominican Republic ($50,204, a difference of 0.090%), Immigrants from Dominica ($50,301, a difference of 0.11%), and White/Caucasian ($50,336, a difference of 0.18%).
| Demographics | Rating | Rank | Householder Income Under 25 years |
| Luxembourgers | 1.2 /100 | #254 | Tragic $50,379 |
| Aleuts | 1.2 /100 | #255 | Tragic $50,377 |
| Immigrants | Cuba | 1.2 /100 | #256 | Tragic $50,374 |
| Lebanese | 1.1 /100 | #257 | Tragic $50,355 |
| Whites/Caucasians | 1.1 /100 | #258 | Tragic $50,336 |
| Immigrants | Dominica | 1.0 /100 | #259 | Tragic $50,301 |
| Hispanics or Latinos | 0.9 /100 | #260 | Tragic $50,279 |
| Hungarians | 0.9 /100 | #261 | Tragic $50,247 |
| Haitians | 0.8 /100 | #262 | Tragic $50,231 |
| Immigrants | Dominican Republic | 0.8 /100 | #263 | Tragic $50,204 |
| Fijians | 0.6 /100 | #264 | Tragic $50,132 |
| Belgians | 0.6 /100 | #265 | Tragic $50,113 |
| Immigrants | Venezuela | 0.6 /100 | #266 | Tragic $50,109 |
| Immigrants | Laos | 0.5 /100 | #267 | Tragic $50,041 |
| Venezuelans | 0.5 /100 | #268 | Tragic $50,011 |