Scottish vs Immigrants from Western Europe Median Female Earnings
COMPARE
Scottish
Immigrants from Western Europe
Median Female Earnings
Median Female Earnings Comparison
Scottish
Immigrants from Western Europe
$38,397
MEDIAN FEMALE EARNINGS
6.3/ 100
METRIC RATING
227th/ 347
METRIC RANK
$41,990
MEDIAN FEMALE EARNINGS
99.2/ 100
METRIC RATING
91st/ 347
METRIC RANK
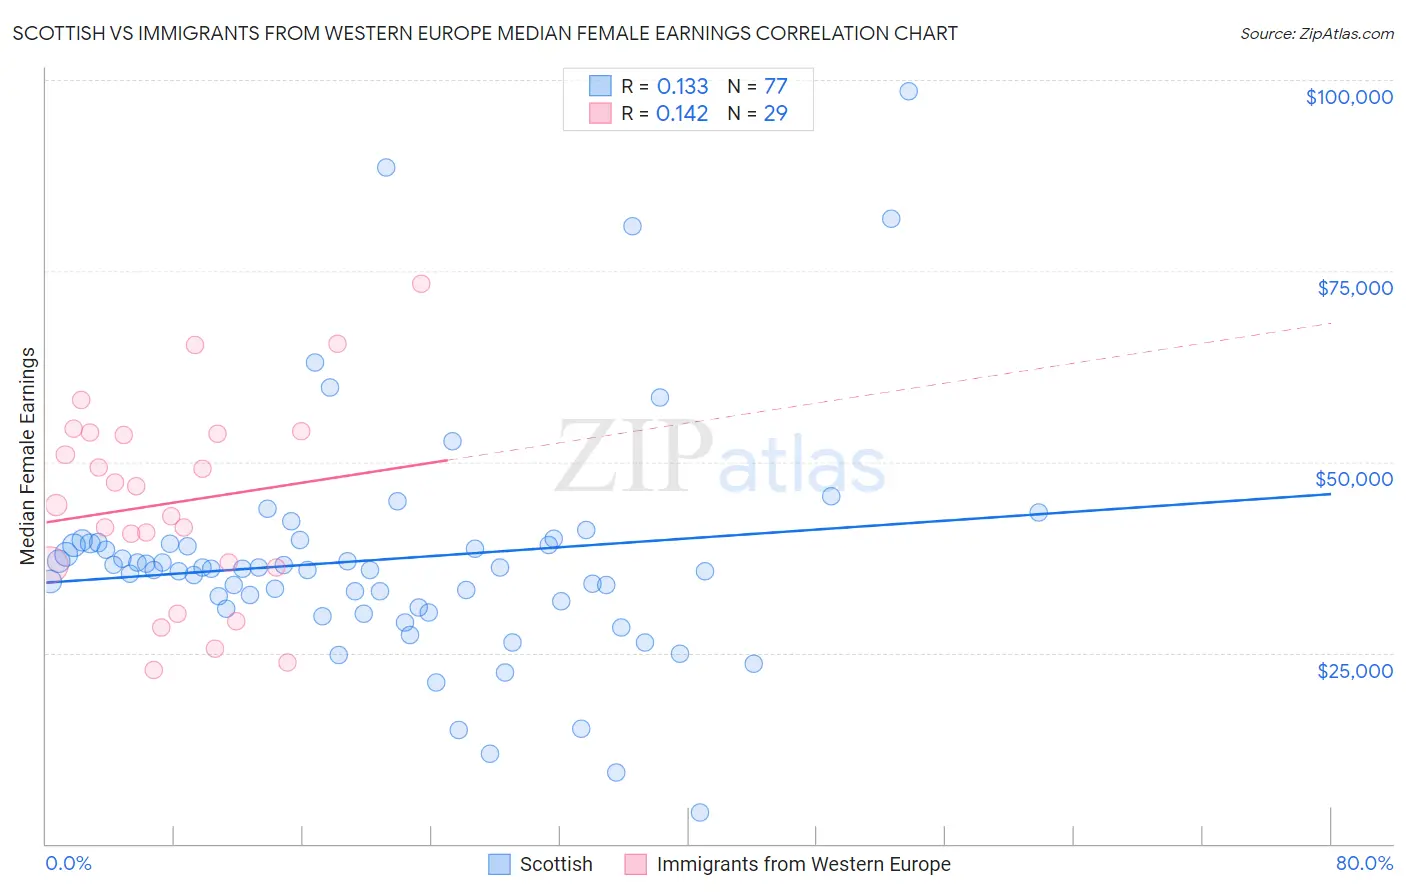
Scottish vs Immigrants from Western Europe Median Female Earnings Correlation Chart
The statistical analysis conducted on geographies consisting of 565,316,168 people shows a poor positive correlation between the proportion of Scottish and median female earnings in the United States with a correlation coefficient (R) of 0.133 and weighted average of $38,397. Similarly, the statistical analysis conducted on geographies consisting of 493,549,383 people shows a poor positive correlation between the proportion of Immigrants from Western Europe and median female earnings in the United States with a correlation coefficient (R) of 0.142 and weighted average of $41,990, a difference of 9.4%.
Median Female Earnings Correlation Summary
| Measurement | Scottish | Immigrants from Western Europe |
| Minimum | $4,115 | $22,777 |
| Maximum | $98,472 | $73,250 |
| Range | $94,357 | $50,473 |
| Mean | $37,218 | $44,663 |
| Median | $35,990 | $44,308 |
| Interquartile 25% (IQ1) | $30,914 | $36,403 |
| Interquartile 75% (IQ3) | $39,333 | $53,740 |
| Interquartile Range (IQR) | $8,419 | $17,337 |
| Standard Deviation (Sample) | $15,319 | $12,864 |
| Standard Deviation (Population) | $15,219 | $12,640 |
Similar Demographics by Median Female Earnings
Demographics Similar to Scottish by Median Female Earnings
In terms of median female earnings, the demographic groups most similar to Scottish are Subsaharan African ($38,391, a difference of 0.020%), Belgian ($38,382, a difference of 0.040%), French Canadian ($38,436, a difference of 0.10%), Basque ($38,352, a difference of 0.12%), and French ($38,457, a difference of 0.15%).
| Demographics | Rating | Rank | Median Female Earnings |
| Yugoslavians | 8.8 /100 | #220 | Tragic $38,573 |
| Immigrants | Azores | 8.8 /100 | #221 | Tragic $38,573 |
| Japanese | 8.1 /100 | #222 | Tragic $38,528 |
| Immigrants | Sudan | 7.8 /100 | #223 | Tragic $38,511 |
| Native Hawaiians | 7.1 /100 | #224 | Tragic $38,461 |
| French | 7.0 /100 | #225 | Tragic $38,457 |
| French Canadians | 6.8 /100 | #226 | Tragic $38,436 |
| Scottish | 6.3 /100 | #227 | Tragic $38,397 |
| Sub-Saharan Africans | 6.2 /100 | #228 | Tragic $38,391 |
| Belgians | 6.1 /100 | #229 | Tragic $38,382 |
| Basques | 5.7 /100 | #230 | Tragic $38,352 |
| Somalis | 5.5 /100 | #231 | Tragic $38,333 |
| Scandinavians | 5.2 /100 | #232 | Tragic $38,306 |
| Tongans | 5.1 /100 | #233 | Tragic $38,288 |
| Celtics | 5.0 /100 | #234 | Tragic $38,283 |
Demographics Similar to Immigrants from Western Europe by Median Female Earnings
In terms of median female earnings, the demographic groups most similar to Immigrants from Western Europe are Ukrainian ($42,015, a difference of 0.060%), Argentinean ($41,952, a difference of 0.090%), Immigrants from Grenada ($41,932, a difference of 0.14%), Immigrants from Afghanistan ($42,055, a difference of 0.15%), and Immigrants from Northern Africa ($42,084, a difference of 0.22%).
| Demographics | Rating | Rank | Median Female Earnings |
| Armenians | 99.5 /100 | #84 | Exceptional $42,212 |
| Laotians | 99.4 /100 | #85 | Exceptional $42,133 |
| Immigrants | St. Vincent and the Grenadines | 99.3 /100 | #86 | Exceptional $42,108 |
| Lithuanians | 99.3 /100 | #87 | Exceptional $42,108 |
| Immigrants | Northern Africa | 99.3 /100 | #88 | Exceptional $42,084 |
| Immigrants | Afghanistan | 99.3 /100 | #89 | Exceptional $42,055 |
| Ukrainians | 99.2 /100 | #90 | Exceptional $42,015 |
| Immigrants | Western Europe | 99.2 /100 | #91 | Exceptional $41,990 |
| Argentineans | 99.1 /100 | #92 | Exceptional $41,952 |
| Immigrants | Grenada | 99.0 /100 | #93 | Exceptional $41,932 |
| Moroccans | 98.9 /100 | #94 | Exceptional $41,872 |
| Immigrants | Netherlands | 98.9 /100 | #95 | Exceptional $41,870 |
| South Africans | 98.8 /100 | #96 | Exceptional $41,825 |
| Immigrants | Hungary | 98.8 /100 | #97 | Exceptional $41,820 |
| Immigrants | Scotland | 98.7 /100 | #98 | Exceptional $41,771 |