Moroccan vs Immigrants from Western Europe Median Female Earnings
COMPARE
Moroccan
Immigrants from Western Europe
Median Female Earnings
Median Female Earnings Comparison
Moroccans
Immigrants from Western Europe
$41,872
MEDIAN FEMALE EARNINGS
98.9/ 100
METRIC RATING
94th/ 347
METRIC RANK
$41,990
MEDIAN FEMALE EARNINGS
99.2/ 100
METRIC RATING
91st/ 347
METRIC RANK
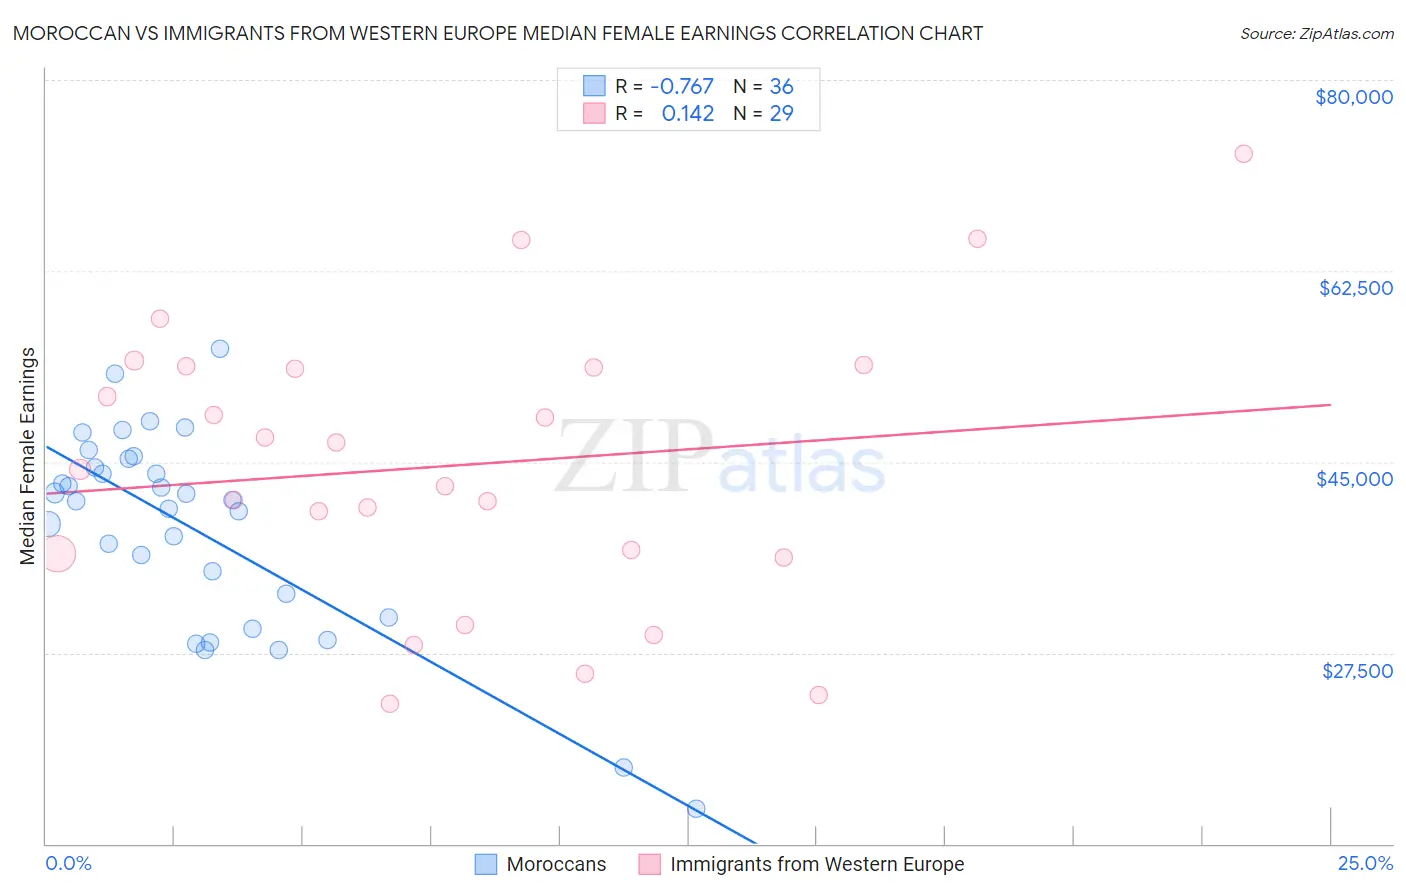
Moroccan vs Immigrants from Western Europe Median Female Earnings Correlation Chart
The statistical analysis conducted on geographies consisting of 201,786,783 people shows a strong negative correlation between the proportion of Moroccans and median female earnings in the United States with a correlation coefficient (R) of -0.767 and weighted average of $41,872. Similarly, the statistical analysis conducted on geographies consisting of 493,549,383 people shows a poor positive correlation between the proportion of Immigrants from Western Europe and median female earnings in the United States with a correlation coefficient (R) of 0.142 and weighted average of $41,990, a difference of 0.28%.
Median Female Earnings Correlation Summary
| Measurement | Moroccan | Immigrants from Western Europe |
| Minimum | $13,173 | $22,777 |
| Maximum | $55,417 | $73,250 |
| Range | $42,244 | $50,473 |
| Mean | $38,834 | $44,663 |
| Median | $41,478 | $44,308 |
| Interquartile 25% (IQ1) | $31,827 | $36,403 |
| Interquartile 75% (IQ3) | $44,890 | $53,740 |
| Interquartile Range (IQR) | $13,063 | $17,337 |
| Standard Deviation (Sample) | $9,328 | $12,864 |
| Standard Deviation (Population) | $9,197 | $12,640 |
Demographics Similar to Moroccans and Immigrants from Western Europe by Median Female Earnings
In terms of median female earnings, the demographic groups most similar to Moroccans are Immigrants from Netherlands ($41,870, a difference of 0.0%), South African ($41,825, a difference of 0.11%), Immigrants from Hungary ($41,820, a difference of 0.12%), Immigrants from Grenada ($41,932, a difference of 0.14%), and Argentinean ($41,952, a difference of 0.19%). Similarly, the demographic groups most similar to Immigrants from Western Europe are Ukrainian ($42,015, a difference of 0.060%), Argentinean ($41,952, a difference of 0.090%), Immigrants from Grenada ($41,932, a difference of 0.14%), Immigrants from Afghanistan ($42,055, a difference of 0.15%), and Immigrants from Northern Africa ($42,084, a difference of 0.22%).
| Demographics | Rating | Rank | Median Female Earnings |
| Immigrants | Morocco | 99.5 /100 | #82 | Exceptional $42,229 |
| Immigrants | Sierra Leone | 99.5 /100 | #83 | Exceptional $42,214 |
| Armenians | 99.5 /100 | #84 | Exceptional $42,212 |
| Laotians | 99.4 /100 | #85 | Exceptional $42,133 |
| Immigrants | St. Vincent and the Grenadines | 99.3 /100 | #86 | Exceptional $42,108 |
| Lithuanians | 99.3 /100 | #87 | Exceptional $42,108 |
| Immigrants | Northern Africa | 99.3 /100 | #88 | Exceptional $42,084 |
| Immigrants | Afghanistan | 99.3 /100 | #89 | Exceptional $42,055 |
| Ukrainians | 99.2 /100 | #90 | Exceptional $42,015 |
| Immigrants | Western Europe | 99.2 /100 | #91 | Exceptional $41,990 |
| Argentineans | 99.1 /100 | #92 | Exceptional $41,952 |
| Immigrants | Grenada | 99.0 /100 | #93 | Exceptional $41,932 |
| Moroccans | 98.9 /100 | #94 | Exceptional $41,872 |
| Immigrants | Netherlands | 98.9 /100 | #95 | Exceptional $41,870 |
| South Africans | 98.8 /100 | #96 | Exceptional $41,825 |
| Immigrants | Hungary | 98.8 /100 | #97 | Exceptional $41,820 |
| Immigrants | Scotland | 98.7 /100 | #98 | Exceptional $41,771 |
| Immigrants | Barbados | 98.4 /100 | #99 | Exceptional $41,685 |
| Romanians | 98.3 /100 | #100 | Exceptional $41,663 |
| Immigrants | Fiji | 98.3 /100 | #101 | Exceptional $41,656 |
| Immigrants | Poland | 98.2 /100 | #102 | Exceptional $41,630 |