Syrian vs Immigrants from Western Europe Single Mother Households
COMPARE
Syrian
Immigrants from Western Europe
Single Mother Households
Single Mother Households Comparison
Syrians
Immigrants from Western Europe
6.0%
SINGLE MOTHER HOUSEHOLDS
86.0/ 100
METRIC RATING
139th/ 347
METRIC RANK
5.8%
SINGLE MOTHER HOUSEHOLDS
95.7/ 100
METRIC RATING
109th/ 347
METRIC RANK
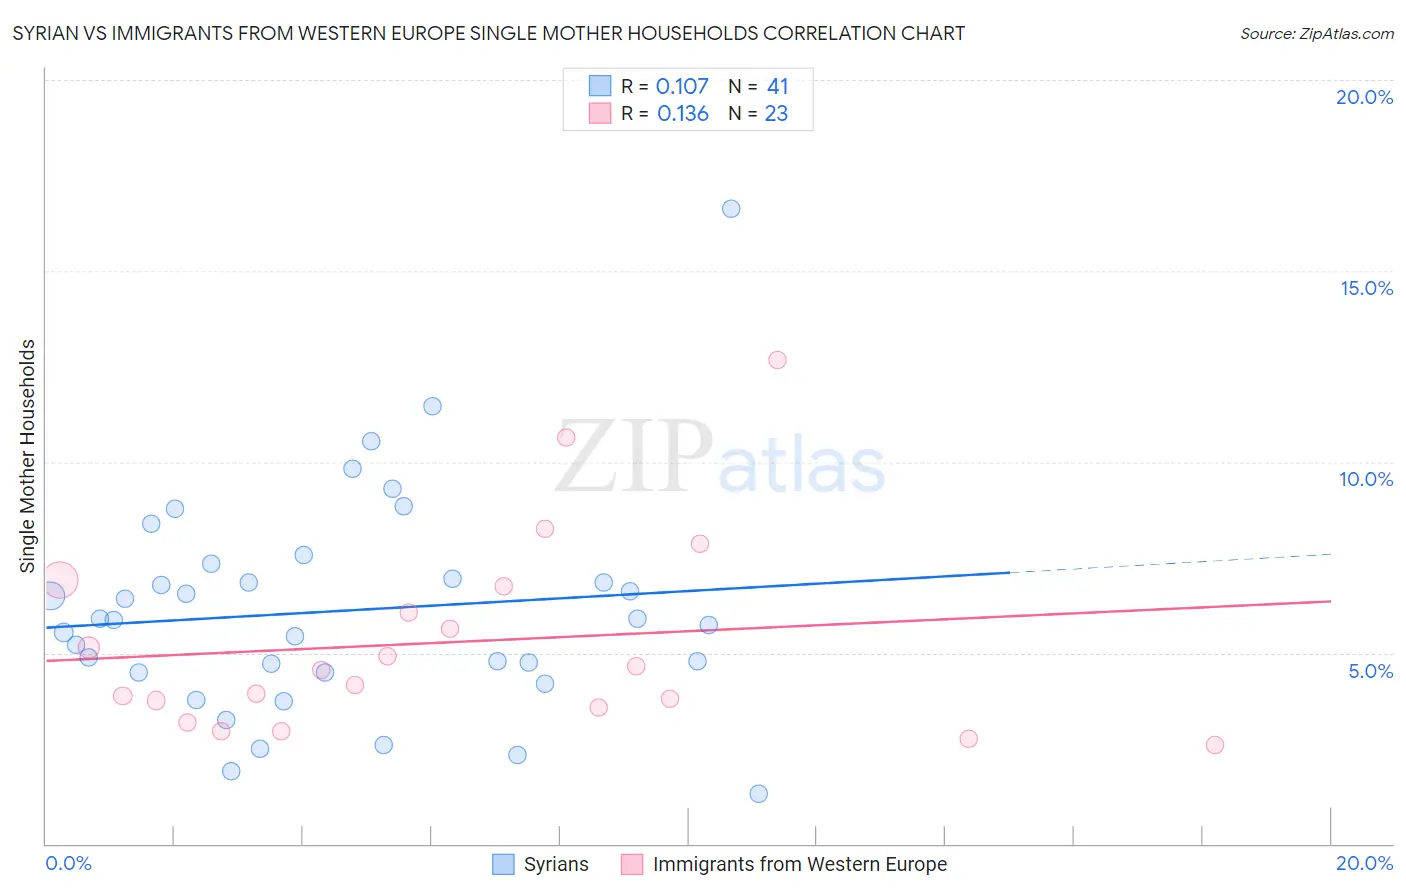
Syrian vs Immigrants from Western Europe Single Mother Households Correlation Chart
The statistical analysis conducted on geographies consisting of 265,755,115 people shows a poor positive correlation between the proportion of Syrians and percentage of single mother households in the United States with a correlation coefficient (R) of 0.107 and weighted average of 6.0%. Similarly, the statistical analysis conducted on geographies consisting of 491,703,619 people shows a poor positive correlation between the proportion of Immigrants from Western Europe and percentage of single mother households in the United States with a correlation coefficient (R) of 0.136 and weighted average of 5.8%, a difference of 3.8%.
Single Mother Households Correlation Summary
| Measurement | Syrian | Immigrants from Western Europe |
| Minimum | 1.3% | 2.6% |
| Maximum | 16.6% | 12.7% |
| Range | 15.3% | 10.1% |
| Mean | 6.1% | 5.3% |
| Median | 5.8% | 4.6% |
| Interquartile 25% (IQ1) | 4.5% | 3.6% |
| Interquartile 75% (IQ3) | 7.1% | 6.7% |
| Interquartile Range (IQR) | 2.7% | 3.2% |
| Standard Deviation (Sample) | 2.9% | 2.6% |
| Standard Deviation (Population) | 2.8% | 2.5% |
Similar Demographics by Single Mother Households
Demographics Similar to Syrians by Single Mother Households
In terms of single mother households, the demographic groups most similar to Syrians are French (6.0%, a difference of 0.070%), Tsimshian (6.0%, a difference of 0.17%), Immigrants from Egypt (6.0%, a difference of 0.22%), Icelander (6.0%, a difference of 0.23%), and Immigrants from Iraq (6.0%, a difference of 0.26%).
| Demographics | Rating | Rank | Single Mother Households |
| Albanians | 91.1 /100 | #132 | Exceptional 5.9% |
| Egyptians | 90.7 /100 | #133 | Exceptional 5.9% |
| Canadians | 90.5 /100 | #134 | Exceptional 5.9% |
| Immigrants | Saudi Arabia | 90.2 /100 | #135 | Exceptional 5.9% |
| Jordanians | 88.9 /100 | #136 | Excellent 6.0% |
| Immigrants | Pakistan | 88.4 /100 | #137 | Excellent 6.0% |
| Icelanders | 86.9 /100 | #138 | Excellent 6.0% |
| Syrians | 86.0 /100 | #139 | Excellent 6.0% |
| French | 85.7 /100 | #140 | Excellent 6.0% |
| Tsimshian | 85.2 /100 | #141 | Excellent 6.0% |
| Immigrants | Egypt | 85.0 /100 | #142 | Excellent 6.0% |
| Immigrants | Iraq | 84.8 /100 | #143 | Excellent 6.0% |
| Koreans | 84.4 /100 | #144 | Excellent 6.0% |
| Arabs | 84.0 /100 | #145 | Excellent 6.0% |
| French Canadians | 82.6 /100 | #146 | Excellent 6.0% |
Demographics Similar to Immigrants from Western Europe by Single Mother Households
In terms of single mother households, the demographic groups most similar to Immigrants from Western Europe are Paraguayan (5.8%, a difference of 0.090%), Immigrants from Italy (5.8%, a difference of 0.090%), British (5.8%, a difference of 0.090%), Immigrants from England (5.8%, a difference of 0.12%), and Immigrants from Kuwait (5.8%, a difference of 0.16%).
| Demographics | Rating | Rank | Single Mother Households |
| English | 96.2 /100 | #102 | Exceptional 5.8% |
| Scottish | 96.2 /100 | #103 | Exceptional 5.8% |
| Northern Europeans | 96.2 /100 | #104 | Exceptional 5.8% |
| Taiwanese | 96.1 /100 | #105 | Exceptional 5.8% |
| Immigrants | Ukraine | 95.9 /100 | #106 | Exceptional 5.8% |
| Paraguayans | 95.8 /100 | #107 | Exceptional 5.8% |
| Immigrants | Italy | 95.8 /100 | #108 | Exceptional 5.8% |
| Immigrants | Western Europe | 95.7 /100 | #109 | Exceptional 5.8% |
| British | 95.5 /100 | #110 | Exceptional 5.8% |
| Immigrants | England | 95.5 /100 | #111 | Exceptional 5.8% |
| Immigrants | Kuwait | 95.4 /100 | #112 | Exceptional 5.8% |
| Mongolians | 95.3 /100 | #113 | Exceptional 5.8% |
| Dutch | 95.1 /100 | #114 | Exceptional 5.8% |
| Irish | 94.8 /100 | #115 | Exceptional 5.8% |
| Pennsylvania Germans | 94.7 /100 | #116 | Exceptional 5.8% |