Syrian vs Immigrants from Western Europe Unemployment Among Seniors over 75 years
COMPARE
Syrian
Immigrants from Western Europe
Unemployment Among Seniors over 75 years
Unemployment Among Seniors over 75 years Comparison
Syrians
Immigrants from Western Europe
8.7%
UNEMPLOYMENT AMONG SENIORS OVER 75 YEARS
49.6/ 100
METRIC RATING
175th/ 347
METRIC RANK
8.9%
UNEMPLOYMENT AMONG SENIORS OVER 75 YEARS
18.2/ 100
METRIC RATING
206th/ 347
METRIC RANK
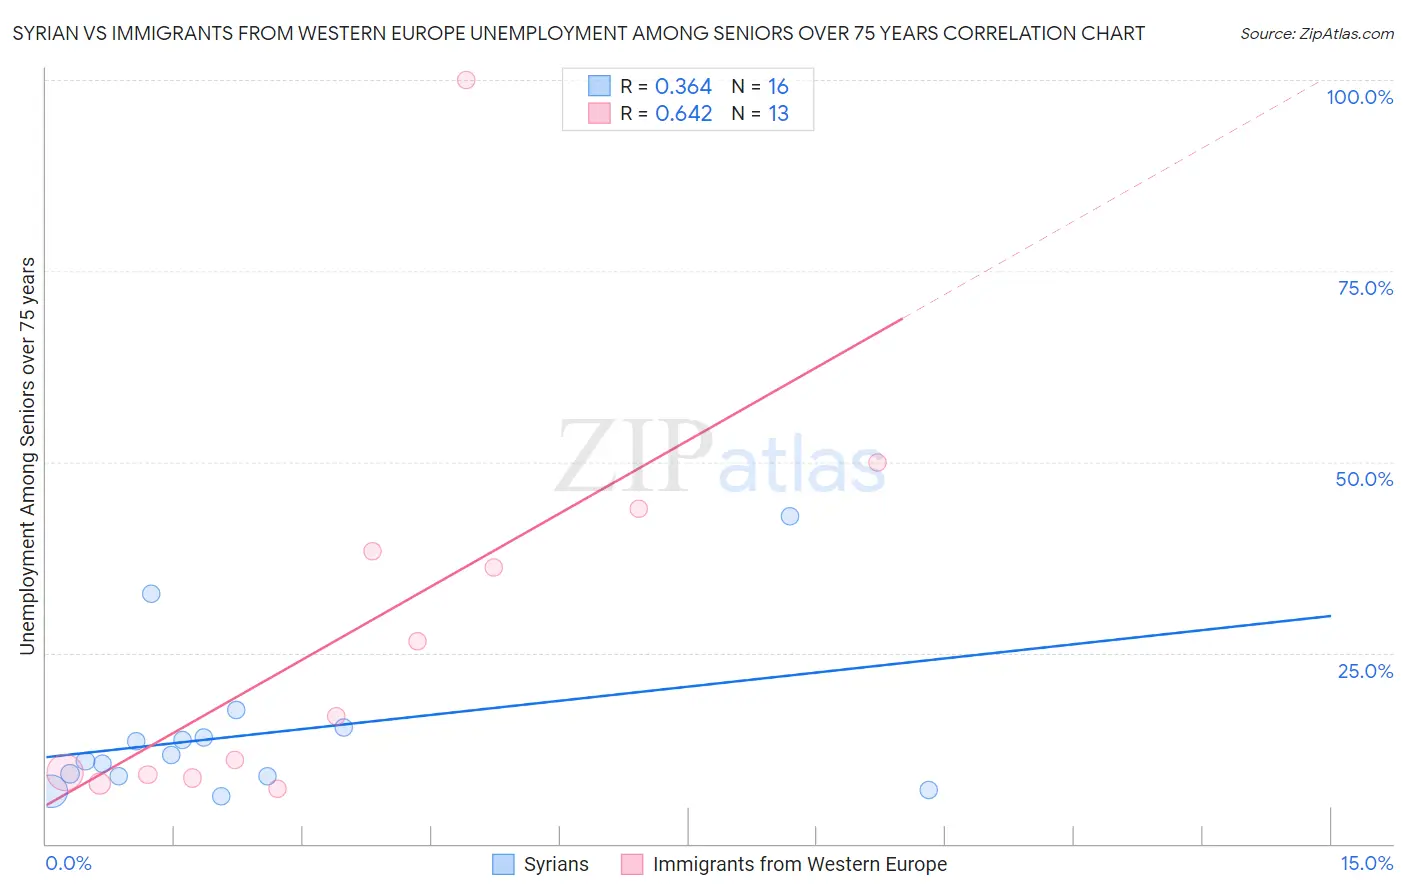
Syrian vs Immigrants from Western Europe Unemployment Among Seniors over 75 years Correlation Chart
The statistical analysis conducted on geographies consisting of 159,275,493 people shows a mild positive correlation between the proportion of Syrians and unemployment rate among seniors over the age of 75 in the United States with a correlation coefficient (R) of 0.364 and weighted average of 8.7%. Similarly, the statistical analysis conducted on geographies consisting of 225,070,494 people shows a significant positive correlation between the proportion of Immigrants from Western Europe and unemployment rate among seniors over the age of 75 in the United States with a correlation coefficient (R) of 0.642 and weighted average of 8.9%, a difference of 2.0%.
Unemployment Among Seniors over 75 years Correlation Summary
| Measurement | Syrian | Immigrants from Western Europe |
| Minimum | 6.2% | 7.2% |
| Maximum | 42.9% | 100.0% |
| Range | 36.7% | 92.8% |
| Mean | 14.3% | 28.1% |
| Median | 11.2% | 16.7% |
| Interquartile 25% (IQ1) | 8.8% | 8.8% |
| Interquartile 75% (IQ3) | 14.6% | 41.1% |
| Interquartile Range (IQR) | 5.7% | 32.3% |
| Standard Deviation (Sample) | 9.9% | 26.5% |
| Standard Deviation (Population) | 9.6% | 25.5% |
Similar Demographics by Unemployment Among Seniors over 75 years
Demographics Similar to Syrians by Unemployment Among Seniors over 75 years
In terms of unemployment among seniors over 75 years, the demographic groups most similar to Syrians are Immigrants from El Salvador (8.7%, a difference of 0.010%), Australian (8.7%, a difference of 0.040%), Dominican (8.7%, a difference of 0.12%), Immigrants (8.7%, a difference of 0.12%), and Somali (8.8%, a difference of 0.23%).
| Demographics | Rating | Rank | Unemployment Among Seniors over 75 years |
| Immigrants | Lithuania | 57.2 /100 | #168 | Average 8.7% |
| Fijians | 56.4 /100 | #169 | Average 8.7% |
| Zimbabweans | 54.1 /100 | #170 | Average 8.7% |
| Dominicans | 51.9 /100 | #171 | Average 8.7% |
| Immigrants | Immigrants | 51.8 /100 | #172 | Average 8.7% |
| Australians | 50.3 /100 | #173 | Average 8.7% |
| Immigrants | El Salvador | 49.7 /100 | #174 | Average 8.7% |
| Syrians | 49.6 /100 | #175 | Average 8.7% |
| Somalis | 45.3 /100 | #176 | Average 8.8% |
| Central Americans | 43.3 /100 | #177 | Average 8.8% |
| West Indians | 41.9 /100 | #178 | Average 8.8% |
| Immigrants | Italy | 41.7 /100 | #179 | Average 8.8% |
| Immigrants | Somalia | 41.7 /100 | #180 | Average 8.8% |
| Immigrants | Thailand | 40.2 /100 | #181 | Average 8.8% |
| Guatemalans | 39.5 /100 | #182 | Fair 8.8% |
Demographics Similar to Immigrants from Western Europe by Unemployment Among Seniors over 75 years
In terms of unemployment among seniors over 75 years, the demographic groups most similar to Immigrants from Western Europe are Malaysian (8.9%, a difference of 0.18%), Immigrants from Philippines (8.9%, a difference of 0.22%), Salvadoran (8.9%, a difference of 0.27%), Korean (8.9%, a difference of 0.30%), and Spaniard (8.9%, a difference of 0.31%).
| Demographics | Rating | Rank | Unemployment Among Seniors over 75 years |
| Pakistanis | 25.4 /100 | #199 | Fair 8.9% |
| Osage | 25.4 /100 | #200 | Fair 8.9% |
| Immigrants | Peru | 24.3 /100 | #201 | Fair 8.9% |
| Russians | 24.1 /100 | #202 | Fair 8.9% |
| Immigrants | Northern Europe | 23.9 /100 | #203 | Fair 8.9% |
| Spaniards | 22.0 /100 | #204 | Fair 8.9% |
| Koreans | 21.9 /100 | #205 | Fair 8.9% |
| Immigrants | Western Europe | 18.2 /100 | #206 | Poor 8.9% |
| Malaysians | 16.3 /100 | #207 | Poor 8.9% |
| Immigrants | Philippines | 15.8 /100 | #208 | Poor 8.9% |
| Salvadorans | 15.4 /100 | #209 | Poor 8.9% |
| Bermudans | 15.0 /100 | #210 | Poor 8.9% |
| Delaware | 14.6 /100 | #211 | Poor 9.0% |
| Romanians | 13.8 /100 | #212 | Poor 9.0% |
| Immigrants | Latin America | 13.4 /100 | #213 | Poor 9.0% |