Bahamian vs Immigrants from Western Europe Median Female Earnings
COMPARE
Bahamian
Immigrants from Western Europe
Median Female Earnings
Median Female Earnings Comparison
Bahamians
Immigrants from Western Europe
$35,125
MEDIAN FEMALE EARNINGS
0.0/ 100
METRIC RATING
305th/ 347
METRIC RANK
$41,990
MEDIAN FEMALE EARNINGS
99.2/ 100
METRIC RATING
91st/ 347
METRIC RANK
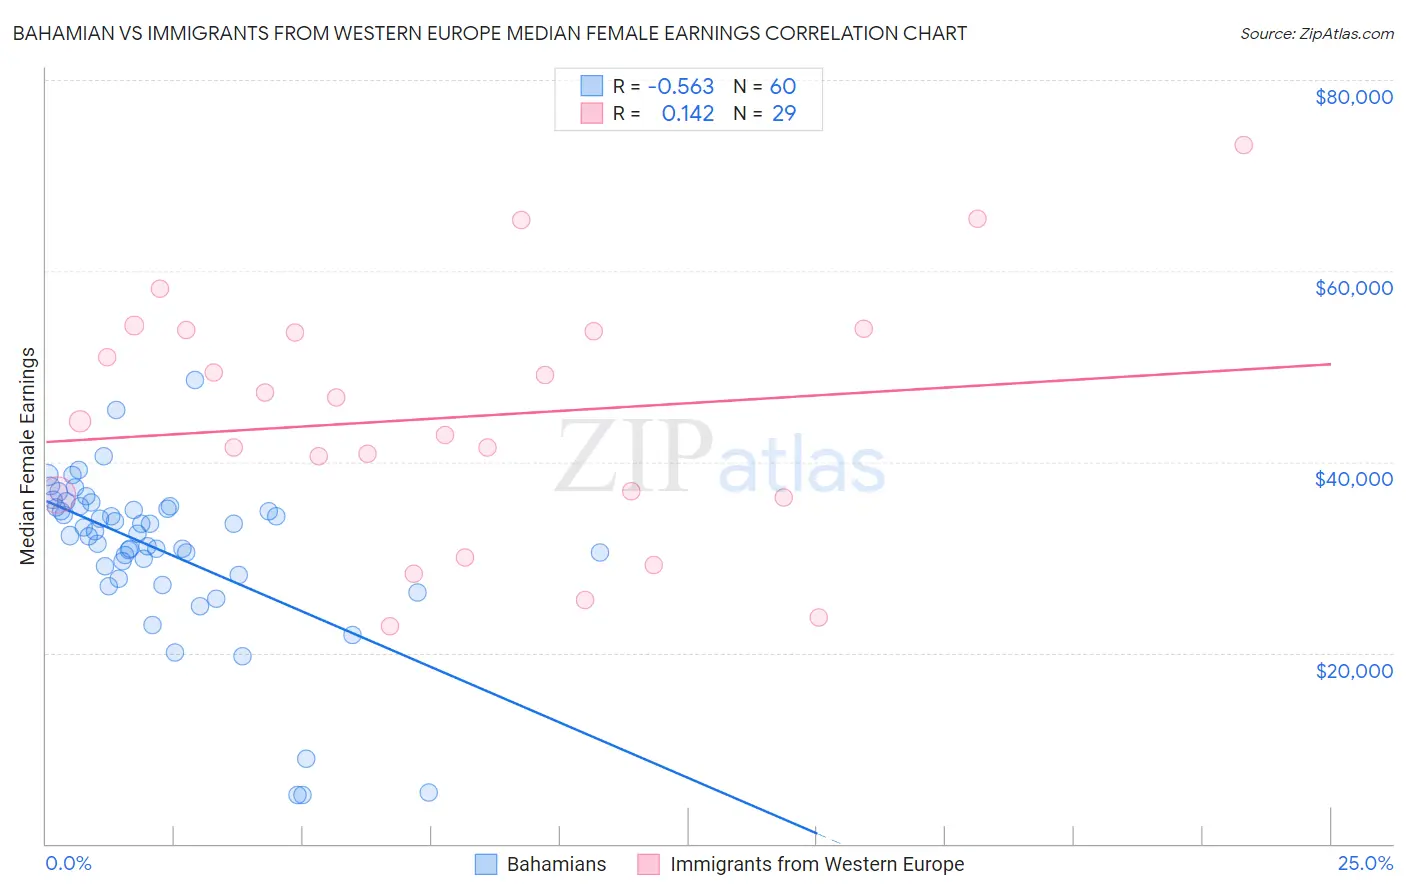
Bahamian vs Immigrants from Western Europe Median Female Earnings Correlation Chart
The statistical analysis conducted on geographies consisting of 112,672,199 people shows a substantial negative correlation between the proportion of Bahamians and median female earnings in the United States with a correlation coefficient (R) of -0.563 and weighted average of $35,125. Similarly, the statistical analysis conducted on geographies consisting of 493,549,383 people shows a poor positive correlation between the proportion of Immigrants from Western Europe and median female earnings in the United States with a correlation coefficient (R) of 0.142 and weighted average of $41,990, a difference of 19.5%.
Median Female Earnings Correlation Summary
| Measurement | Bahamian | Immigrants from Western Europe |
| Minimum | $5,063 | $22,777 |
| Maximum | $48,590 | $73,250 |
| Range | $43,527 | $50,473 |
| Mean | $30,808 | $44,663 |
| Median | $32,617 | $44,308 |
| Interquartile 25% (IQ1) | $28,645 | $36,403 |
| Interquartile 75% (IQ3) | $35,290 | $53,740 |
| Interquartile Range (IQR) | $6,645 | $17,337 |
| Standard Deviation (Sample) | $8,476 | $12,864 |
| Standard Deviation (Population) | $8,405 | $12,640 |
Similar Demographics by Median Female Earnings
Demographics Similar to Bahamians by Median Female Earnings
In terms of median female earnings, the demographic groups most similar to Bahamians are Fijian ($35,114, a difference of 0.030%), Sioux ($35,063, a difference of 0.18%), Immigrants from Bahamas ($35,027, a difference of 0.28%), Honduran ($35,013, a difference of 0.32%), and Chippewa ($35,003, a difference of 0.35%).
| Demographics | Rating | Rank | Median Female Earnings |
| Immigrants | Micronesia | 0.0 /100 | #298 | Tragic $35,477 |
| Immigrants | Guatemala | 0.0 /100 | #299 | Tragic $35,444 |
| Yuman | 0.0 /100 | #300 | Tragic $35,377 |
| Pima | 0.0 /100 | #301 | Tragic $35,326 |
| Blacks/African Americans | 0.0 /100 | #302 | Tragic $35,315 |
| Immigrants | Latin America | 0.0 /100 | #303 | Tragic $35,307 |
| Crow | 0.0 /100 | #304 | Tragic $35,266 |
| Bahamians | 0.0 /100 | #305 | Tragic $35,125 |
| Fijians | 0.0 /100 | #306 | Tragic $35,114 |
| Sioux | 0.0 /100 | #307 | Tragic $35,063 |
| Immigrants | Bahamas | 0.0 /100 | #308 | Tragic $35,027 |
| Hondurans | 0.0 /100 | #309 | Tragic $35,013 |
| Chippewa | 0.0 /100 | #310 | Tragic $35,003 |
| Ute | 0.0 /100 | #311 | Tragic $34,960 |
| Yaqui | 0.0 /100 | #312 | Tragic $34,943 |
Demographics Similar to Immigrants from Western Europe by Median Female Earnings
In terms of median female earnings, the demographic groups most similar to Immigrants from Western Europe are Ukrainian ($42,015, a difference of 0.060%), Argentinean ($41,952, a difference of 0.090%), Immigrants from Grenada ($41,932, a difference of 0.14%), Immigrants from Afghanistan ($42,055, a difference of 0.15%), and Immigrants from Northern Africa ($42,084, a difference of 0.22%).
| Demographics | Rating | Rank | Median Female Earnings |
| Armenians | 99.5 /100 | #84 | Exceptional $42,212 |
| Laotians | 99.4 /100 | #85 | Exceptional $42,133 |
| Immigrants | St. Vincent and the Grenadines | 99.3 /100 | #86 | Exceptional $42,108 |
| Lithuanians | 99.3 /100 | #87 | Exceptional $42,108 |
| Immigrants | Northern Africa | 99.3 /100 | #88 | Exceptional $42,084 |
| Immigrants | Afghanistan | 99.3 /100 | #89 | Exceptional $42,055 |
| Ukrainians | 99.2 /100 | #90 | Exceptional $42,015 |
| Immigrants | Western Europe | 99.2 /100 | #91 | Exceptional $41,990 |
| Argentineans | 99.1 /100 | #92 | Exceptional $41,952 |
| Immigrants | Grenada | 99.0 /100 | #93 | Exceptional $41,932 |
| Moroccans | 98.9 /100 | #94 | Exceptional $41,872 |
| Immigrants | Netherlands | 98.9 /100 | #95 | Exceptional $41,870 |
| South Africans | 98.8 /100 | #96 | Exceptional $41,825 |
| Immigrants | Hungary | 98.8 /100 | #97 | Exceptional $41,820 |
| Immigrants | Scotland | 98.7 /100 | #98 | Exceptional $41,771 |