Syrian vs Immigrants from Belgium Average Family Size
COMPARE
Syrian
Immigrants from Belgium
Average Family Size
Average Family Size Comparison
Syrians
Immigrants from Belgium
3.19
AVERAGE FAMILY SIZE
6.5/ 100
METRIC RATING
224th/ 347
METRIC RANK
3.15
AVERAGE FAMILY SIZE
0.6/ 100
METRIC RATING
274th/ 347
METRIC RANK
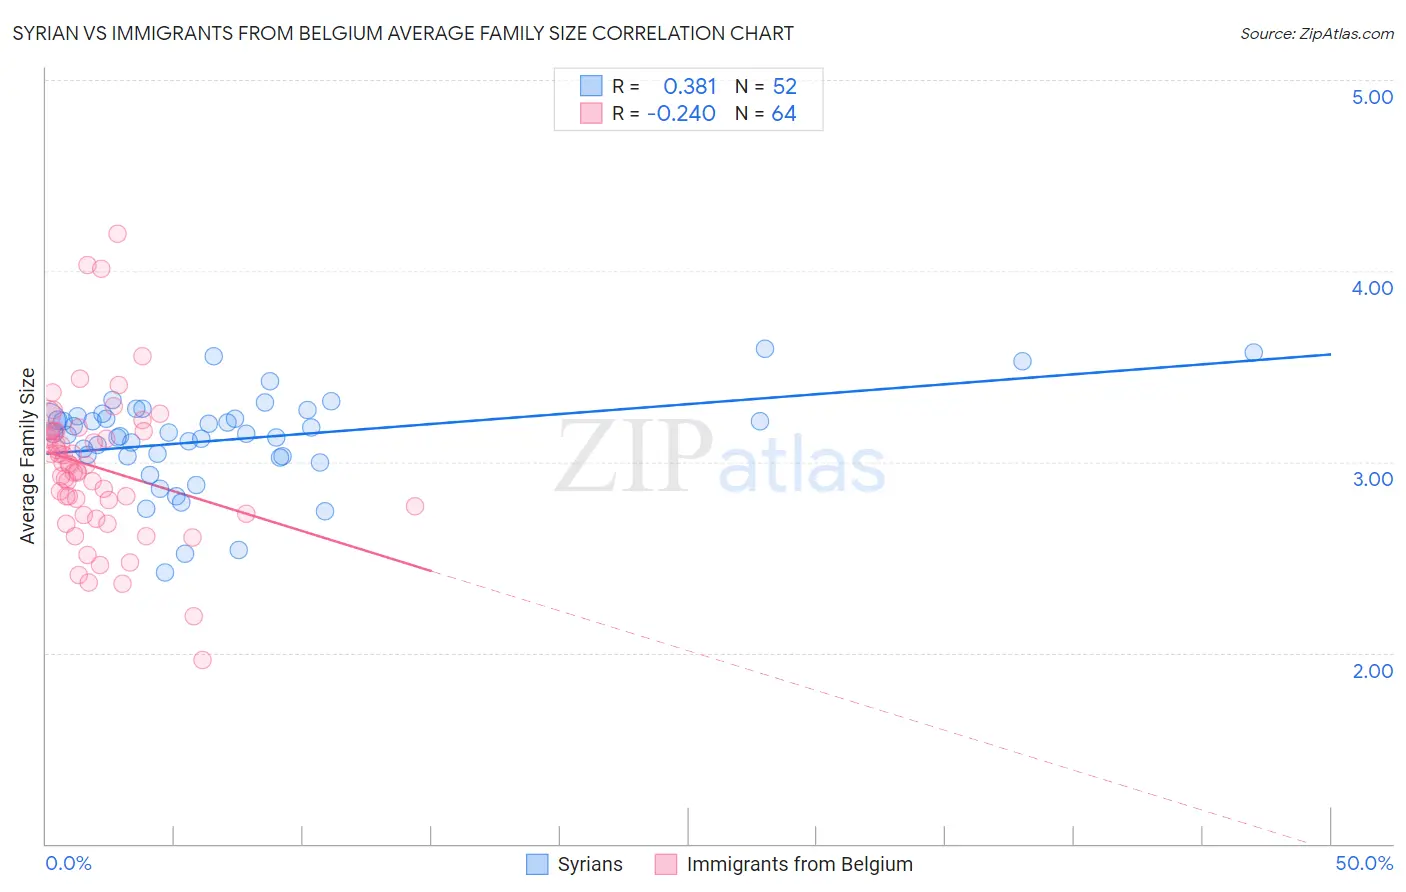
Syrian vs Immigrants from Belgium Average Family Size Correlation Chart
The statistical analysis conducted on geographies consisting of 266,181,875 people shows a mild positive correlation between the proportion of Syrians and average family size in the United States with a correlation coefficient (R) of 0.381 and weighted average of 3.19. Similarly, the statistical analysis conducted on geographies consisting of 146,697,928 people shows a weak negative correlation between the proportion of Immigrants from Belgium and average family size in the United States with a correlation coefficient (R) of -0.240 and weighted average of 3.15, a difference of 1.1%.
Average Family Size Correlation Summary
| Measurement | Syrian | Immigrants from Belgium |
| Minimum | 2.42 | 1.96 |
| Maximum | 3.59 | 4.19 |
| Range | 1.17 | 2.23 |
| Mean | 3.12 | 2.97 |
| Median | 3.15 | 2.98 |
| Interquartile 25% (IQ1) | 3.03 | 2.75 |
| Interquartile 75% (IQ3) | 3.23 | 3.16 |
| Interquartile Range (IQR) | 0.20 | 0.41 |
| Standard Deviation (Sample) | 0.25 | 0.39 |
| Standard Deviation (Population) | 0.24 | 0.39 |
Similar Demographics by Average Family Size
Demographics Similar to Syrians by Average Family Size
In terms of average family size, the demographic groups most similar to Syrians are Cree (3.19, a difference of 0.020%), Immigrants from Zimbabwe (3.19, a difference of 0.040%), Chickasaw (3.19, a difference of 0.040%), Portuguese (3.19, a difference of 0.040%), and Immigrants from Ukraine (3.19, a difference of 0.050%).
| Demographics | Rating | Rank | Average Family Size |
| Immigrants | Somalia | 10.3 /100 | #217 | Poor 3.20 |
| French American Indians | 9.8 /100 | #218 | Tragic 3.20 |
| Pennsylvania Germans | 9.3 /100 | #219 | Tragic 3.19 |
| Lebanese | 9.1 /100 | #220 | Tragic 3.19 |
| Immigrants | Ukraine | 7.2 /100 | #221 | Tragic 3.19 |
| Immigrants | Kuwait | 7.2 /100 | #222 | Tragic 3.19 |
| Immigrants | Zimbabwe | 7.1 /100 | #223 | Tragic 3.19 |
| Syrians | 6.5 /100 | #224 | Tragic 3.19 |
| Cree | 6.2 /100 | #225 | Tragic 3.19 |
| Chickasaw | 6.0 /100 | #226 | Tragic 3.19 |
| Portuguese | 6.0 /100 | #227 | Tragic 3.19 |
| Immigrants | Nonimmigrants | 5.7 /100 | #228 | Tragic 3.19 |
| Immigrants | Italy | 5.3 /100 | #229 | Tragic 3.19 |
| Icelanders | 5.2 /100 | #230 | Tragic 3.19 |
| Basques | 5.2 /100 | #231 | Tragic 3.19 |
Demographics Similar to Immigrants from Belgium by Average Family Size
In terms of average family size, the demographic groups most similar to Immigrants from Belgium are New Zealander (3.15, a difference of 0.0%), Cambodian (3.15, a difference of 0.0%), Immigrants from Lithuania (3.15, a difference of 0.020%), Immigrants from Germany (3.15, a difference of 0.030%), and Tlingit-Haida (3.16, a difference of 0.060%).
| Demographics | Rating | Rank | Average Family Size |
| Iroquois | 0.8 /100 | #267 | Tragic 3.16 |
| Maltese | 0.8 /100 | #268 | Tragic 3.16 |
| Immigrants | Singapore | 0.7 /100 | #269 | Tragic 3.16 |
| Tlingit-Haida | 0.7 /100 | #270 | Tragic 3.16 |
| Immigrants | Germany | 0.7 /100 | #271 | Tragic 3.15 |
| Immigrants | Lithuania | 0.6 /100 | #272 | Tragic 3.15 |
| New Zealanders | 0.6 /100 | #273 | Tragic 3.15 |
| Immigrants | Belgium | 0.6 /100 | #274 | Tragic 3.15 |
| Cambodians | 0.6 /100 | #275 | Tragic 3.15 |
| Immigrants | Bosnia and Herzegovina | 0.5 /100 | #276 | Tragic 3.15 |
| Swiss | 0.5 /100 | #277 | Tragic 3.15 |
| Okinawans | 0.5 /100 | #278 | Tragic 3.15 |
| Immigrants | Europe | 0.5 /100 | #279 | Tragic 3.15 |
| Immigrants | England | 0.4 /100 | #280 | Tragic 3.15 |
| Immigrants | Denmark | 0.4 /100 | #281 | Tragic 3.15 |