Syrian vs Immigrants from Belgium Per Capita Income
COMPARE
Syrian
Immigrants from Belgium
Per Capita Income
Per Capita Income Comparison
Syrians
Immigrants from Belgium
$46,837
PER CAPITA INCOME
97.2/ 100
METRIC RATING
103rd/ 347
METRIC RANK
$55,082
PER CAPITA INCOME
100.0/ 100
METRIC RATING
14th/ 347
METRIC RANK
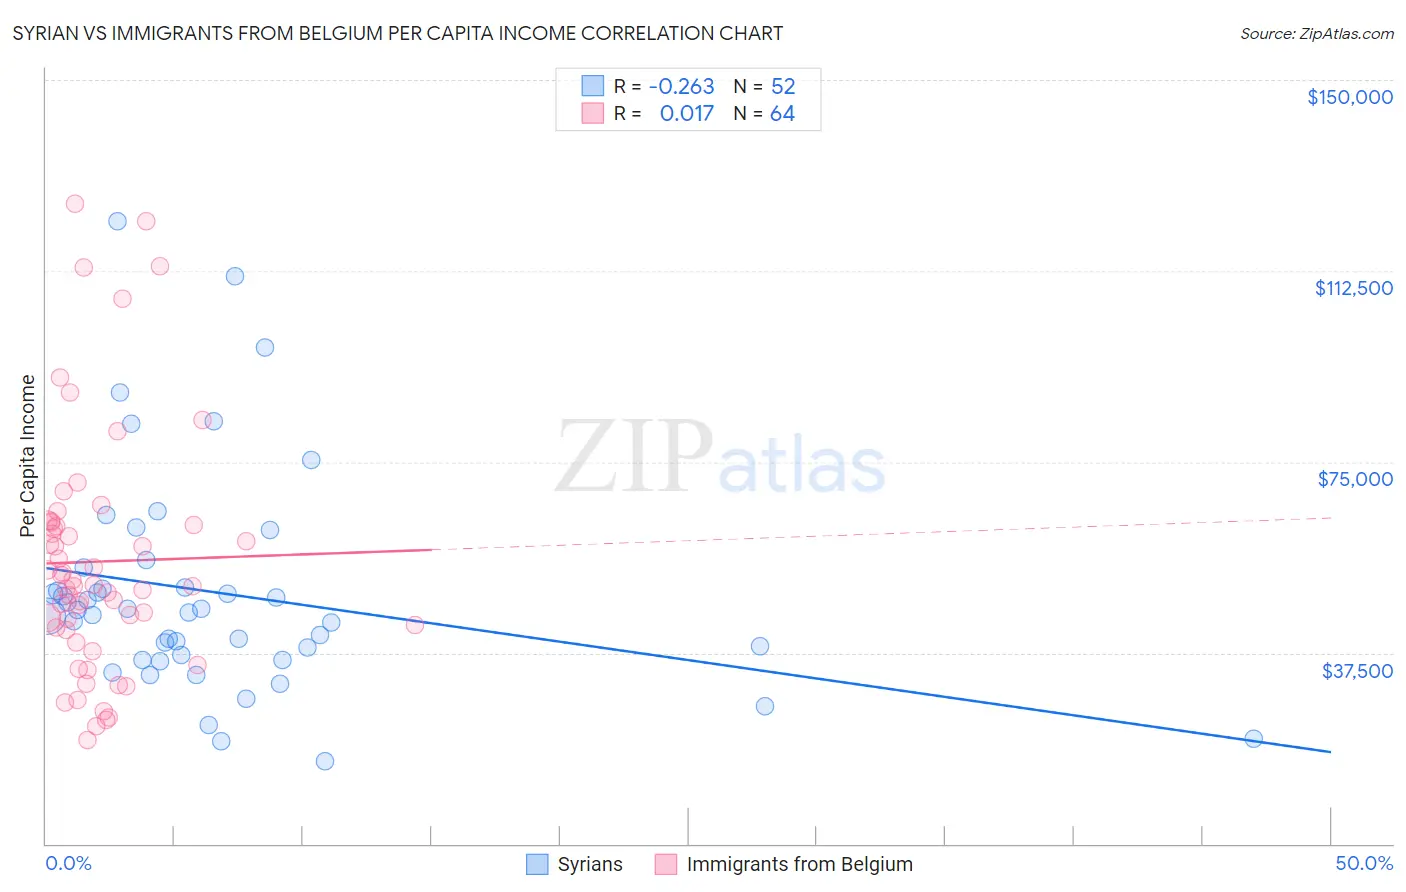
Syrian vs Immigrants from Belgium Per Capita Income Correlation Chart
The statistical analysis conducted on geographies consisting of 266,332,251 people shows a weak negative correlation between the proportion of Syrians and per capita income in the United States with a correlation coefficient (R) of -0.263 and weighted average of $46,837. Similarly, the statistical analysis conducted on geographies consisting of 146,715,223 people shows no correlation between the proportion of Immigrants from Belgium and per capita income in the United States with a correlation coefficient (R) of 0.017 and weighted average of $55,082, a difference of 17.6%.
Per Capita Income Correlation Summary
| Measurement | Syrian | Immigrants from Belgium |
| Minimum | $16,296 | $20,313 |
| Maximum | $122,379 | $125,796 |
| Range | $106,083 | $105,483 |
| Mean | $49,326 | $55,426 |
| Median | $45,708 | $50,708 |
| Interquartile 25% (IQ1) | $36,580 | $42,261 |
| Interquartile 75% (IQ3) | $52,298 | $62,896 |
| Interquartile Range (IQR) | $15,717 | $20,635 |
| Standard Deviation (Sample) | $21,603 | $23,673 |
| Standard Deviation (Population) | $21,394 | $23,487 |
Similar Demographics by Per Capita Income
Demographics Similar to Syrians by Per Capita Income
In terms of per capita income, the demographic groups most similar to Syrians are Immigrants from Western Asia ($46,876, a difference of 0.080%), Immigrants from Uzbekistan ($46,929, a difference of 0.20%), Immigrants from Lebanon ($46,938, a difference of 0.22%), Brazilian ($46,700, a difference of 0.29%), and Laotian ($47,041, a difference of 0.43%).
| Demographics | Rating | Rank | Per Capita Income |
| Alsatians | 98.3 /100 | #96 | Exceptional $47,284 |
| Carpatho Rusyns | 98.2 /100 | #97 | Exceptional $47,248 |
| Immigrants | Pakistan | 97.9 /100 | #98 | Exceptional $47,084 |
| Laotians | 97.8 /100 | #99 | Exceptional $47,041 |
| Immigrants | Lebanon | 97.5 /100 | #100 | Exceptional $46,938 |
| Immigrants | Uzbekistan | 97.5 /100 | #101 | Exceptional $46,929 |
| Immigrants | Western Asia | 97.4 /100 | #102 | Exceptional $46,876 |
| Syrians | 97.2 /100 | #103 | Exceptional $46,837 |
| Brazilians | 96.8 /100 | #104 | Exceptional $46,700 |
| British | 96.3 /100 | #105 | Exceptional $46,571 |
| Ethiopians | 96.3 /100 | #106 | Exceptional $46,569 |
| Serbians | 96.2 /100 | #107 | Exceptional $46,551 |
| Immigrants | Kuwait | 96.2 /100 | #108 | Exceptional $46,543 |
| Immigrants | Northern Africa | 96.2 /100 | #109 | Exceptional $46,531 |
| Chileans | 95.9 /100 | #110 | Exceptional $46,459 |
Demographics Similar to Immigrants from Belgium by Per Capita Income
In terms of per capita income, the demographic groups most similar to Immigrants from Belgium are Cypriot ($54,899, a difference of 0.33%), Immigrants from India ($55,268, a difference of 0.34%), Immigrants from Switzerland ($54,866, a difference of 0.39%), Immigrants from Sweden ($55,582, a difference of 0.91%), and Immigrants from France ($54,557, a difference of 0.96%).
| Demographics | Rating | Rank | Per Capita Income |
| Immigrants | Israel | 100.0 /100 | #7 | Exceptional $57,384 |
| Immigrants | Hong Kong | 100.0 /100 | #8 | Exceptional $56,709 |
| Immigrants | Ireland | 100.0 /100 | #9 | Exceptional $56,584 |
| Okinawans | 100.0 /100 | #10 | Exceptional $55,817 |
| Eastern Europeans | 100.0 /100 | #11 | Exceptional $55,780 |
| Immigrants | Sweden | 100.0 /100 | #12 | Exceptional $55,582 |
| Immigrants | India | 100.0 /100 | #13 | Exceptional $55,268 |
| Immigrants | Belgium | 100.0 /100 | #14 | Exceptional $55,082 |
| Cypriots | 100.0 /100 | #15 | Exceptional $54,899 |
| Immigrants | Switzerland | 100.0 /100 | #16 | Exceptional $54,866 |
| Immigrants | France | 100.0 /100 | #17 | Exceptional $54,557 |
| Thais | 100.0 /100 | #18 | Exceptional $54,307 |
| Immigrants | China | 100.0 /100 | #19 | Exceptional $54,264 |
| Soviet Union | 100.0 /100 | #20 | Exceptional $54,202 |
| Immigrants | Northern Europe | 100.0 /100 | #21 | Exceptional $54,159 |