White/Caucasian vs Immigrants from Belgium Median Female Earnings
COMPARE
White/Caucasian
Immigrants from Belgium
Median Female Earnings
Median Female Earnings Comparison
Whites/Caucasians
Immigrants from Belgium
$37,531
MEDIAN FEMALE EARNINGS
1.1/ 100
METRIC RATING
254th/ 347
METRIC RANK
$44,587
MEDIAN FEMALE EARNINGS
100.0/ 100
METRIC RATING
29th/ 347
METRIC RANK
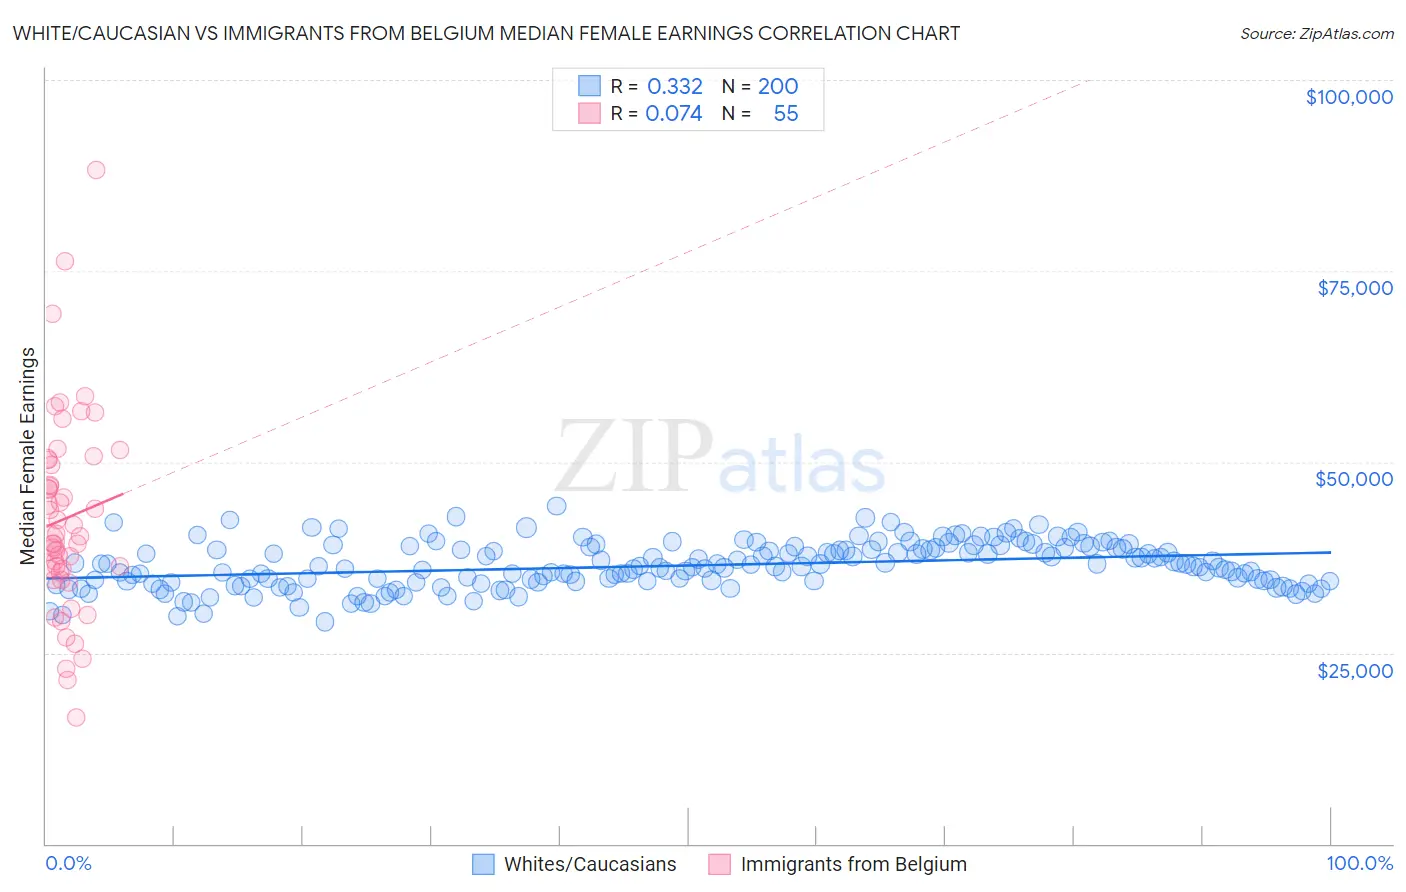
White/Caucasian vs Immigrants from Belgium Median Female Earnings Correlation Chart
The statistical analysis conducted on geographies consisting of 581,839,033 people shows a mild positive correlation between the proportion of Whites/Caucasians and median female earnings in the United States with a correlation coefficient (R) of 0.332 and weighted average of $37,531. Similarly, the statistical analysis conducted on geographies consisting of 146,688,407 people shows a slight positive correlation between the proportion of Immigrants from Belgium and median female earnings in the United States with a correlation coefficient (R) of 0.074 and weighted average of $44,587, a difference of 18.8%.
Median Female Earnings Correlation Summary
| Measurement | White/Caucasian | Immigrants from Belgium |
| Minimum | $29,061 | $16,513 |
| Maximum | $44,249 | $88,194 |
| Range | $15,187 | $71,681 |
| Mean | $36,445 | $42,604 |
| Median | $36,298 | $40,333 |
| Interquartile 25% (IQ1) | $34,375 | $35,589 |
| Interquartile 75% (IQ3) | $38,681 | $50,235 |
| Interquartile Range (IQR) | $4,306 | $14,647 |
| Standard Deviation (Sample) | $2,956 | $13,110 |
| Standard Deviation (Population) | $2,949 | $12,990 |
Similar Demographics by Median Female Earnings
Demographics Similar to Whites/Caucasians by Median Female Earnings
In terms of median female earnings, the demographic groups most similar to Whites/Caucasians are Colville ($37,514, a difference of 0.040%), Samoan ($37,498, a difference of 0.090%), Hawaiian ($37,497, a difference of 0.090%), Belizean ($37,429, a difference of 0.27%), and Scotch-Irish ($37,383, a difference of 0.39%).
| Demographics | Rating | Rank | Median Female Earnings |
| Immigrants | Somalia | 2.4 /100 | #247 | Tragic $37,914 |
| Alaskan Athabascans | 2.3 /100 | #248 | Tragic $37,905 |
| Swiss | 2.3 /100 | #249 | Tragic $37,904 |
| Immigrants | Iraq | 2.2 /100 | #250 | Tragic $37,864 |
| Welsh | 2.1 /100 | #251 | Tragic $37,856 |
| Immigrants | Dominica | 2.0 /100 | #252 | Tragic $37,825 |
| Danes | 1.6 /100 | #253 | Tragic $37,730 |
| Whites/Caucasians | 1.1 /100 | #254 | Tragic $37,531 |
| Colville | 1.1 /100 | #255 | Tragic $37,514 |
| Samoans | 1.0 /100 | #256 | Tragic $37,498 |
| Hawaiians | 1.0 /100 | #257 | Tragic $37,497 |
| Belizeans | 0.9 /100 | #258 | Tragic $37,429 |
| Scotch-Irish | 0.8 /100 | #259 | Tragic $37,383 |
| Dutch | 0.7 /100 | #260 | Tragic $37,339 |
| Malaysians | 0.7 /100 | #261 | Tragic $37,298 |
Demographics Similar to Immigrants from Belgium by Median Female Earnings
In terms of median female earnings, the demographic groups most similar to Immigrants from Belgium are Asian ($44,586, a difference of 0.0%), Immigrants from France ($44,541, a difference of 0.10%), Immigrants from Russia ($44,680, a difference of 0.21%), Turkish ($44,695, a difference of 0.24%), and Immigrants from Belarus ($44,757, a difference of 0.38%).
| Demographics | Rating | Rank | Median Female Earnings |
| Immigrants | Greece | 100.0 /100 | #22 | Exceptional $44,976 |
| Burmese | 100.0 /100 | #23 | Exceptional $44,911 |
| Immigrants | Korea | 100.0 /100 | #24 | Exceptional $44,847 |
| Immigrants | Sweden | 100.0 /100 | #25 | Exceptional $44,774 |
| Immigrants | Belarus | 100.0 /100 | #26 | Exceptional $44,757 |
| Turks | 100.0 /100 | #27 | Exceptional $44,695 |
| Immigrants | Russia | 100.0 /100 | #28 | Exceptional $44,680 |
| Immigrants | Belgium | 100.0 /100 | #29 | Exceptional $44,587 |
| Asians | 100.0 /100 | #30 | Exceptional $44,586 |
| Immigrants | France | 100.0 /100 | #31 | Exceptional $44,541 |
| Immigrants | Northern Europe | 100.0 /100 | #32 | Exceptional $44,366 |
| Immigrants | Asia | 100.0 /100 | #33 | Exceptional $44,198 |
| Russians | 100.0 /100 | #34 | Exceptional $44,169 |
| Immigrants | Sri Lanka | 100.0 /100 | #35 | Exceptional $44,161 |
| Immigrants | Turkey | 100.0 /100 | #36 | Exceptional $44,066 |