Russian vs Immigrants from Belgium Median Female Earnings
COMPARE
Russian
Immigrants from Belgium
Median Female Earnings
Median Female Earnings Comparison
Russians
Immigrants from Belgium
$44,169
MEDIAN FEMALE EARNINGS
100.0/ 100
METRIC RATING
34th/ 347
METRIC RANK
$44,587
MEDIAN FEMALE EARNINGS
100.0/ 100
METRIC RATING
29th/ 347
METRIC RANK
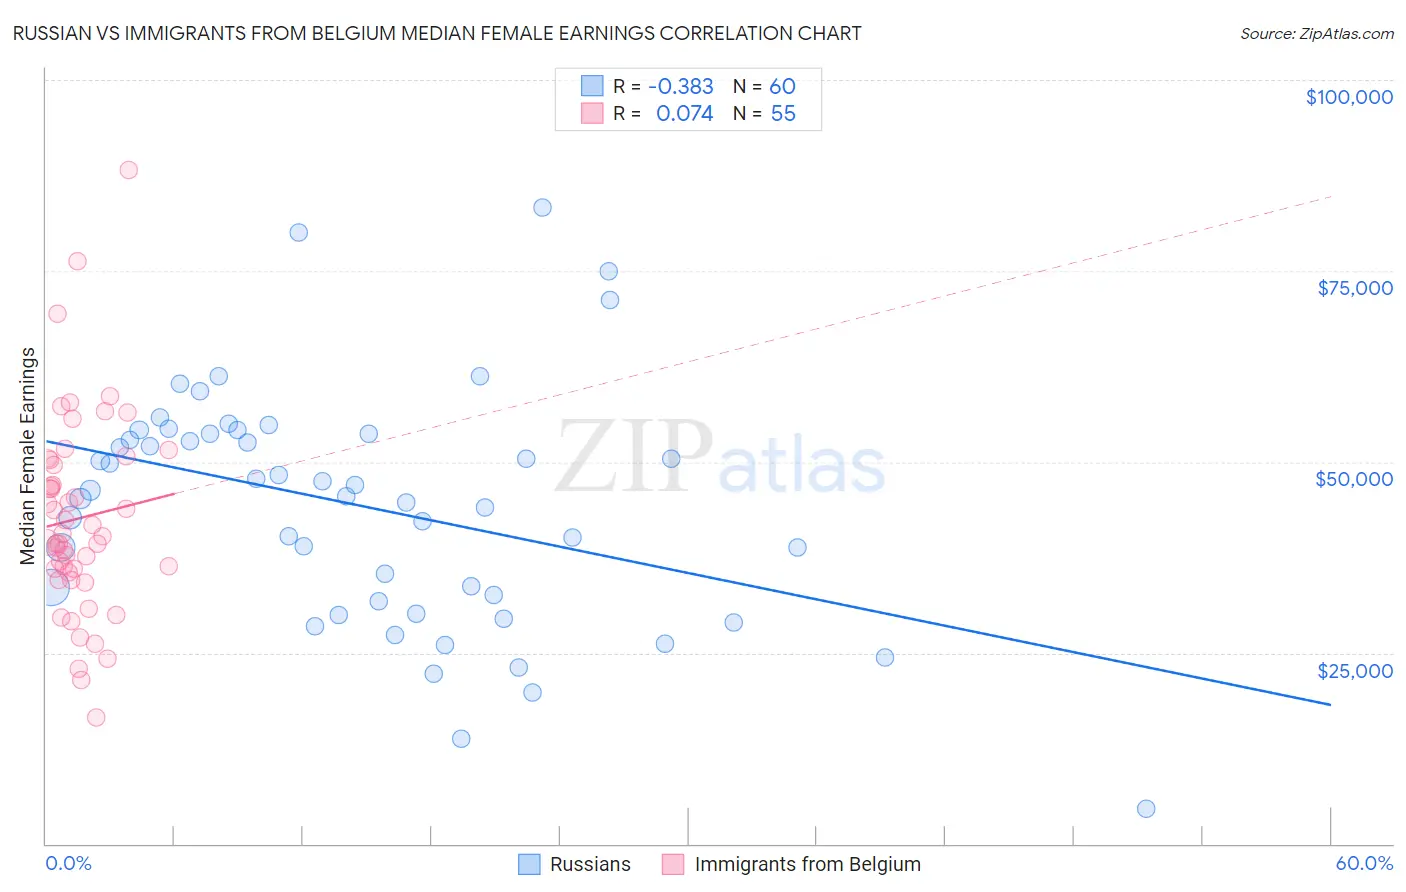
Russian vs Immigrants from Belgium Median Female Earnings Correlation Chart
The statistical analysis conducted on geographies consisting of 511,592,990 people shows a mild negative correlation between the proportion of Russians and median female earnings in the United States with a correlation coefficient (R) of -0.383 and weighted average of $44,169. Similarly, the statistical analysis conducted on geographies consisting of 146,688,407 people shows a slight positive correlation between the proportion of Immigrants from Belgium and median female earnings in the United States with a correlation coefficient (R) of 0.074 and weighted average of $44,587, a difference of 0.95%.
Median Female Earnings Correlation Summary
| Measurement | Russian | Immigrants from Belgium |
| Minimum | $4,625 | $16,513 |
| Maximum | $83,305 | $88,194 |
| Range | $78,680 | $71,681 |
| Mean | $44,153 | $42,604 |
| Median | $45,890 | $40,333 |
| Interquartile 25% (IQ1) | $32,157 | $35,589 |
| Interquartile 75% (IQ3) | $53,697 | $50,235 |
| Interquartile Range (IQR) | $21,540 | $14,647 |
| Standard Deviation (Sample) | $15,453 | $13,110 |
| Standard Deviation (Population) | $15,323 | $12,990 |
Demographics Similar to Russians and Immigrants from Belgium by Median Female Earnings
In terms of median female earnings, the demographic groups most similar to Russians are Immigrants from Sri Lanka ($44,161, a difference of 0.020%), Immigrants from Asia ($44,198, a difference of 0.070%), Immigrants from Turkey ($44,066, a difference of 0.23%), Immigrants from Switzerland ($43,996, a difference of 0.39%), and Immigrants from Northern Europe ($44,366, a difference of 0.44%). Similarly, the demographic groups most similar to Immigrants from Belgium are Asian ($44,586, a difference of 0.0%), Immigrants from France ($44,541, a difference of 0.10%), Immigrants from Russia ($44,680, a difference of 0.21%), Turkish ($44,695, a difference of 0.24%), and Immigrants from Belarus ($44,757, a difference of 0.38%).
| Demographics | Rating | Rank | Median Female Earnings |
| Cambodians | 100.0 /100 | #21 | Exceptional $45,014 |
| Immigrants | Greece | 100.0 /100 | #22 | Exceptional $44,976 |
| Burmese | 100.0 /100 | #23 | Exceptional $44,911 |
| Immigrants | Korea | 100.0 /100 | #24 | Exceptional $44,847 |
| Immigrants | Sweden | 100.0 /100 | #25 | Exceptional $44,774 |
| Immigrants | Belarus | 100.0 /100 | #26 | Exceptional $44,757 |
| Turks | 100.0 /100 | #27 | Exceptional $44,695 |
| Immigrants | Russia | 100.0 /100 | #28 | Exceptional $44,680 |
| Immigrants | Belgium | 100.0 /100 | #29 | Exceptional $44,587 |
| Asians | 100.0 /100 | #30 | Exceptional $44,586 |
| Immigrants | France | 100.0 /100 | #31 | Exceptional $44,541 |
| Immigrants | Northern Europe | 100.0 /100 | #32 | Exceptional $44,366 |
| Immigrants | Asia | 100.0 /100 | #33 | Exceptional $44,198 |
| Russians | 100.0 /100 | #34 | Exceptional $44,169 |
| Immigrants | Sri Lanka | 100.0 /100 | #35 | Exceptional $44,161 |
| Immigrants | Turkey | 100.0 /100 | #36 | Exceptional $44,066 |
| Immigrants | Switzerland | 100.0 /100 | #37 | Exceptional $43,996 |
| Latvians | 100.0 /100 | #38 | Exceptional $43,941 |
| Israelis | 100.0 /100 | #39 | Exceptional $43,852 |
| Immigrants | Malaysia | 100.0 /100 | #40 | Exceptional $43,835 |
| Bhutanese | 100.0 /100 | #41 | Exceptional $43,648 |