Yakama vs Immigrants from Belgium Median Female Earnings
COMPARE
Yakama
Immigrants from Belgium
Median Female Earnings
Median Female Earnings Comparison
Yakama
Immigrants from Belgium
$33,354
MEDIAN FEMALE EARNINGS
0.0/ 100
METRIC RATING
337th/ 347
METRIC RANK
$44,587
MEDIAN FEMALE EARNINGS
100.0/ 100
METRIC RATING
29th/ 347
METRIC RANK
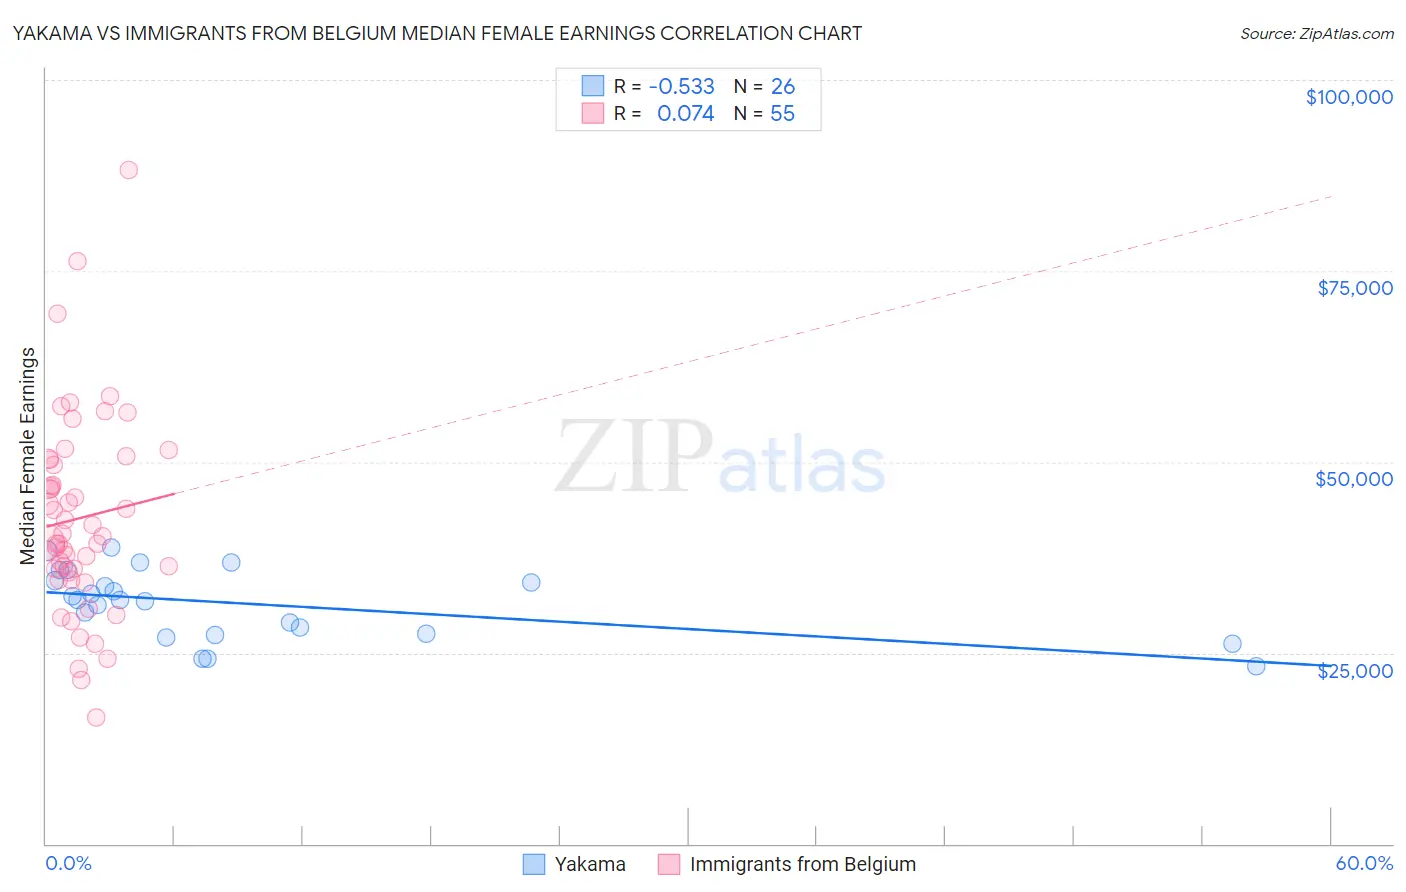
Yakama vs Immigrants from Belgium Median Female Earnings Correlation Chart
The statistical analysis conducted on geographies consisting of 19,910,730 people shows a substantial negative correlation between the proportion of Yakama and median female earnings in the United States with a correlation coefficient (R) of -0.533 and weighted average of $33,354. Similarly, the statistical analysis conducted on geographies consisting of 146,688,407 people shows a slight positive correlation between the proportion of Immigrants from Belgium and median female earnings in the United States with a correlation coefficient (R) of 0.074 and weighted average of $44,587, a difference of 33.7%.
Median Female Earnings Correlation Summary
| Measurement | Yakama | Immigrants from Belgium |
| Minimum | $23,214 | $16,513 |
| Maximum | $38,750 | $88,194 |
| Range | $15,536 | $71,681 |
| Mean | $31,429 | $42,604 |
| Median | $31,931 | $40,333 |
| Interquartile 25% (IQ1) | $27,516 | $35,589 |
| Interquartile 75% (IQ3) | $34,456 | $50,235 |
| Interquartile Range (IQR) | $6,940 | $14,647 |
| Standard Deviation (Sample) | $4,456 | $13,110 |
| Standard Deviation (Population) | $4,370 | $12,990 |
Similar Demographics by Median Female Earnings
Demographics Similar to Yakama by Median Female Earnings
In terms of median female earnings, the demographic groups most similar to Yakama are Ottawa ($33,378, a difference of 0.070%), Immigrants from Cuba ($33,291, a difference of 0.19%), Creek ($33,437, a difference of 0.25%), Immigrants from Mexico ($33,236, a difference of 0.36%), and Tohono O'odham ($33,205, a difference of 0.45%).
| Demographics | Rating | Rank | Median Female Earnings |
| Menominee | 0.0 /100 | #330 | Tragic $33,894 |
| Natives/Alaskans | 0.0 /100 | #331 | Tragic $33,806 |
| Choctaw | 0.0 /100 | #332 | Tragic $33,775 |
| Mexicans | 0.0 /100 | #333 | Tragic $33,664 |
| Spanish American Indians | 0.0 /100 | #334 | Tragic $33,625 |
| Creek | 0.0 /100 | #335 | Tragic $33,437 |
| Ottawa | 0.0 /100 | #336 | Tragic $33,378 |
| Yakama | 0.0 /100 | #337 | Tragic $33,354 |
| Immigrants | Cuba | 0.0 /100 | #338 | Tragic $33,291 |
| Immigrants | Mexico | 0.0 /100 | #339 | Tragic $33,236 |
| Tohono O'odham | 0.0 /100 | #340 | Tragic $33,205 |
| Navajo | 0.0 /100 | #341 | Tragic $33,046 |
| Yup'ik | 0.0 /100 | #342 | Tragic $32,730 |
| Pueblo | 0.0 /100 | #343 | Tragic $32,564 |
| Lumbee | 0.0 /100 | #344 | Tragic $32,500 |
Demographics Similar to Immigrants from Belgium by Median Female Earnings
In terms of median female earnings, the demographic groups most similar to Immigrants from Belgium are Asian ($44,586, a difference of 0.0%), Immigrants from France ($44,541, a difference of 0.10%), Immigrants from Russia ($44,680, a difference of 0.21%), Turkish ($44,695, a difference of 0.24%), and Immigrants from Belarus ($44,757, a difference of 0.38%).
| Demographics | Rating | Rank | Median Female Earnings |
| Immigrants | Greece | 100.0 /100 | #22 | Exceptional $44,976 |
| Burmese | 100.0 /100 | #23 | Exceptional $44,911 |
| Immigrants | Korea | 100.0 /100 | #24 | Exceptional $44,847 |
| Immigrants | Sweden | 100.0 /100 | #25 | Exceptional $44,774 |
| Immigrants | Belarus | 100.0 /100 | #26 | Exceptional $44,757 |
| Turks | 100.0 /100 | #27 | Exceptional $44,695 |
| Immigrants | Russia | 100.0 /100 | #28 | Exceptional $44,680 |
| Immigrants | Belgium | 100.0 /100 | #29 | Exceptional $44,587 |
| Asians | 100.0 /100 | #30 | Exceptional $44,586 |
| Immigrants | France | 100.0 /100 | #31 | Exceptional $44,541 |
| Immigrants | Northern Europe | 100.0 /100 | #32 | Exceptional $44,366 |
| Immigrants | Asia | 100.0 /100 | #33 | Exceptional $44,198 |
| Russians | 100.0 /100 | #34 | Exceptional $44,169 |
| Immigrants | Sri Lanka | 100.0 /100 | #35 | Exceptional $44,161 |
| Immigrants | Turkey | 100.0 /100 | #36 | Exceptional $44,066 |