Immigrants from Bolivia vs Immigrants from Belgium Median Female Earnings
COMPARE
Immigrants from Bolivia
Immigrants from Belgium
Median Female Earnings
Median Female Earnings Comparison
Immigrants from Bolivia
Immigrants from Belgium
$43,467
MEDIAN FEMALE EARNINGS
100.0/ 100
METRIC RATING
46th/ 347
METRIC RANK
$44,587
MEDIAN FEMALE EARNINGS
100.0/ 100
METRIC RATING
29th/ 347
METRIC RANK
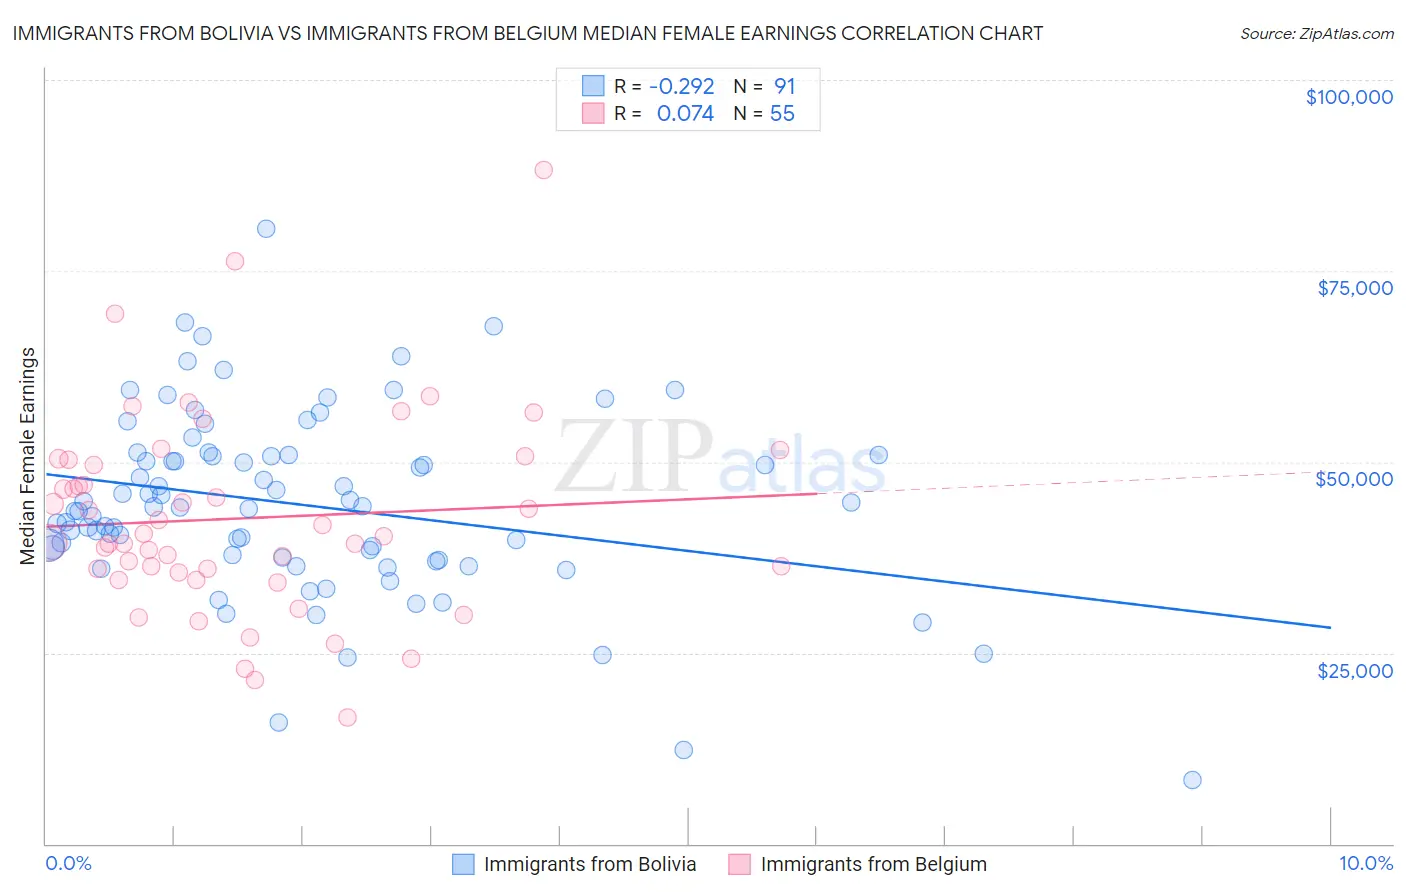
Immigrants from Bolivia vs Immigrants from Belgium Median Female Earnings Correlation Chart
The statistical analysis conducted on geographies consisting of 158,712,262 people shows a weak negative correlation between the proportion of Immigrants from Bolivia and median female earnings in the United States with a correlation coefficient (R) of -0.292 and weighted average of $43,467. Similarly, the statistical analysis conducted on geographies consisting of 146,688,407 people shows a slight positive correlation between the proportion of Immigrants from Belgium and median female earnings in the United States with a correlation coefficient (R) of 0.074 and weighted average of $44,587, a difference of 2.6%.
Median Female Earnings Correlation Summary
| Measurement | Immigrants from Bolivia | Immigrants from Belgium |
| Minimum | $8,362 | $16,513 |
| Maximum | $80,500 | $88,194 |
| Range | $72,138 | $71,681 |
| Mean | $44,359 | $42,604 |
| Median | $43,989 | $40,333 |
| Interquartile 25% (IQ1) | $37,479 | $35,589 |
| Interquartile 75% (IQ3) | $50,958 | $50,235 |
| Interquartile Range (IQR) | $13,479 | $14,647 |
| Standard Deviation (Sample) | $12,073 | $13,110 |
| Standard Deviation (Population) | $12,007 | $12,990 |
Demographics Similar to Immigrants from Bolivia and Immigrants from Belgium by Median Female Earnings
In terms of median female earnings, the demographic groups most similar to Immigrants from Bolivia are Bolivian ($43,445, a difference of 0.050%), Immigrants from Europe ($43,523, a difference of 0.13%), Immigrants from Czechoslovakia ($43,571, a difference of 0.24%), Bulgarian ($43,638, a difference of 0.39%), and Immigrants from Denmark ($43,646, a difference of 0.41%). Similarly, the demographic groups most similar to Immigrants from Belgium are Asian ($44,586, a difference of 0.0%), Immigrants from France ($44,541, a difference of 0.10%), Immigrants from Russia ($44,680, a difference of 0.21%), Turkish ($44,695, a difference of 0.24%), and Immigrants from Northern Europe ($44,366, a difference of 0.50%).
| Demographics | Rating | Rank | Median Female Earnings |
| Turks | 100.0 /100 | #27 | Exceptional $44,695 |
| Immigrants | Russia | 100.0 /100 | #28 | Exceptional $44,680 |
| Immigrants | Belgium | 100.0 /100 | #29 | Exceptional $44,587 |
| Asians | 100.0 /100 | #30 | Exceptional $44,586 |
| Immigrants | France | 100.0 /100 | #31 | Exceptional $44,541 |
| Immigrants | Northern Europe | 100.0 /100 | #32 | Exceptional $44,366 |
| Immigrants | Asia | 100.0 /100 | #33 | Exceptional $44,198 |
| Russians | 100.0 /100 | #34 | Exceptional $44,169 |
| Immigrants | Sri Lanka | 100.0 /100 | #35 | Exceptional $44,161 |
| Immigrants | Turkey | 100.0 /100 | #36 | Exceptional $44,066 |
| Immigrants | Switzerland | 100.0 /100 | #37 | Exceptional $43,996 |
| Latvians | 100.0 /100 | #38 | Exceptional $43,941 |
| Israelis | 100.0 /100 | #39 | Exceptional $43,852 |
| Immigrants | Malaysia | 100.0 /100 | #40 | Exceptional $43,835 |
| Bhutanese | 100.0 /100 | #41 | Exceptional $43,648 |
| Immigrants | Denmark | 100.0 /100 | #42 | Exceptional $43,646 |
| Bulgarians | 100.0 /100 | #43 | Exceptional $43,638 |
| Immigrants | Czechoslovakia | 100.0 /100 | #44 | Exceptional $43,571 |
| Immigrants | Europe | 100.0 /100 | #45 | Exceptional $43,523 |
| Immigrants | Bolivia | 100.0 /100 | #46 | Exceptional $43,467 |
| Bolivians | 100.0 /100 | #47 | Exceptional $43,445 |