Swedish vs Romanian Median Male Earnings
COMPARE
Swedish
Romanian
Median Male Earnings
Median Male Earnings Comparison
Swedes
Romanians
$57,445
MEDIAN MALE EARNINGS
94.8/ 100
METRIC RATING
115th/ 347
METRIC RANK
$60,063
MEDIAN MALE EARNINGS
99.6/ 100
METRIC RATING
76th/ 347
METRIC RANK
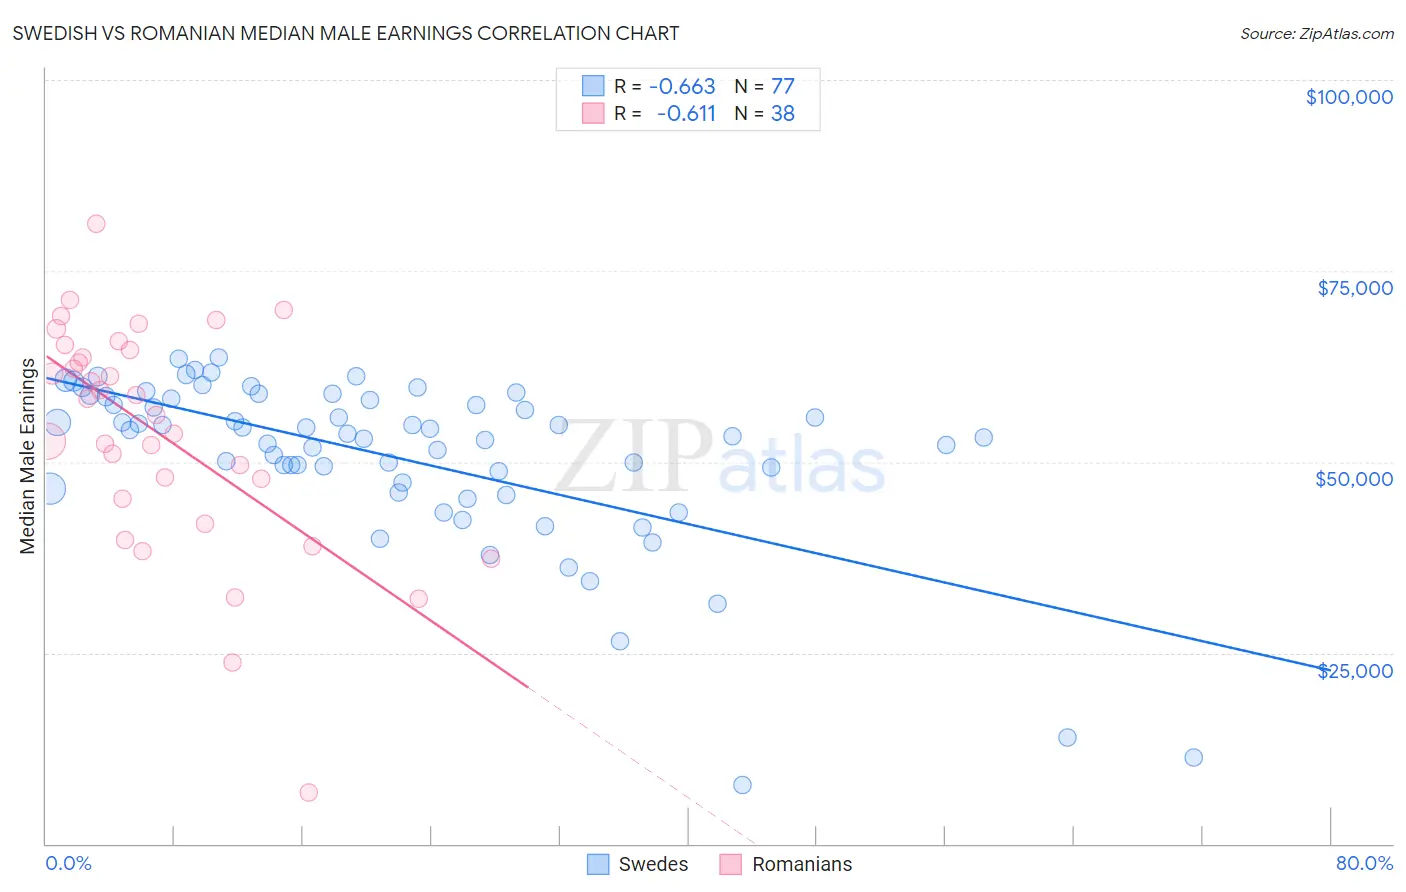
Swedish vs Romanian Median Male Earnings Correlation Chart
The statistical analysis conducted on geographies consisting of 538,411,583 people shows a significant negative correlation between the proportion of Swedes and median male earnings in the United States with a correlation coefficient (R) of -0.663 and weighted average of $57,445. Similarly, the statistical analysis conducted on geographies consisting of 377,805,375 people shows a significant negative correlation between the proportion of Romanians and median male earnings in the United States with a correlation coefficient (R) of -0.611 and weighted average of $60,063, a difference of 4.6%.
Median Male Earnings Correlation Summary
| Measurement | Swedish | Romanian |
| Minimum | $7,750 | $6,645 |
| Maximum | $63,730 | $81,155 |
| Range | $55,980 | $74,510 |
| Mean | $50,664 | $53,672 |
| Median | $53,721 | $57,202 |
| Interquartile 25% (IQ1) | $46,926 | $45,217 |
| Interquartile 75% (IQ3) | $58,399 | $64,624 |
| Interquartile Range (IQR) | $11,473 | $19,407 |
| Standard Deviation (Sample) | $11,170 | $15,023 |
| Standard Deviation (Population) | $11,097 | $14,824 |
Similar Demographics by Median Male Earnings
Demographics Similar to Swedes by Median Male Earnings
In terms of median male earnings, the demographic groups most similar to Swedes are Lebanese ($57,409, a difference of 0.060%), Immigrants from Zimbabwe ($57,352, a difference of 0.16%), Immigrants from Kuwait ($57,562, a difference of 0.20%), Carpatho Rusyn ($57,572, a difference of 0.22%), and Immigrants from Afghanistan ($57,582, a difference of 0.24%).
| Demographics | Rating | Rank | Median Male Earnings |
| Immigrants | Uzbekistan | 96.7 /100 | #108 | Exceptional $57,941 |
| British | 96.5 /100 | #109 | Exceptional $57,890 |
| Palestinians | 96.2 /100 | #110 | Exceptional $57,778 |
| Europeans | 95.6 /100 | #111 | Exceptional $57,637 |
| Immigrants | Afghanistan | 95.4 /100 | #112 | Exceptional $57,582 |
| Carpatho Rusyns | 95.3 /100 | #113 | Exceptional $57,572 |
| Immigrants | Kuwait | 95.3 /100 | #114 | Exceptional $57,562 |
| Swedes | 94.8 /100 | #115 | Exceptional $57,445 |
| Lebanese | 94.6 /100 | #116 | Exceptional $57,409 |
| Immigrants | Zimbabwe | 94.3 /100 | #117 | Exceptional $57,352 |
| Hungarians | 94.0 /100 | #118 | Exceptional $57,309 |
| Arabs | 94.0 /100 | #119 | Exceptional $57,298 |
| Canadians | 93.9 /100 | #120 | Exceptional $57,286 |
| Immigrants | Albania | 93.3 /100 | #121 | Exceptional $57,179 |
| Immigrants | Jordan | 93.1 /100 | #122 | Exceptional $57,145 |
Demographics Similar to Romanians by Median Male Earnings
In terms of median male earnings, the demographic groups most similar to Romanians are Immigrants from Bolivia ($60,088, a difference of 0.040%), Argentinean ($60,117, a difference of 0.090%), Paraguayan ($59,975, a difference of 0.15%), Immigrants from Egypt ($59,925, a difference of 0.23%), and Immigrants from North America ($60,265, a difference of 0.34%).
| Demographics | Rating | Rank | Median Male Earnings |
| Immigrants | Canada | 99.7 /100 | #69 | Exceptional $60,388 |
| Immigrants | Bulgaria | 99.7 /100 | #70 | Exceptional $60,358 |
| Mongolians | 99.7 /100 | #71 | Exceptional $60,350 |
| Immigrants | Western Europe | 99.7 /100 | #72 | Exceptional $60,334 |
| Immigrants | North America | 99.7 /100 | #73 | Exceptional $60,265 |
| Argentineans | 99.6 /100 | #74 | Exceptional $60,117 |
| Immigrants | Bolivia | 99.6 /100 | #75 | Exceptional $60,088 |
| Romanians | 99.6 /100 | #76 | Exceptional $60,063 |
| Paraguayans | 99.5 /100 | #77 | Exceptional $59,975 |
| Immigrants | Egypt | 99.5 /100 | #78 | Exceptional $59,925 |
| Immigrants | Ukraine | 99.5 /100 | #79 | Exceptional $59,820 |
| Immigrants | Hungary | 99.5 /100 | #80 | Exceptional $59,806 |
| Ukrainians | 99.4 /100 | #81 | Exceptional $59,728 |
| Croatians | 99.4 /100 | #82 | Exceptional $59,715 |
| Immigrants | Italy | 99.4 /100 | #83 | Exceptional $59,691 |