Swedish vs Immigrants from Pakistan Median Male Earnings
COMPARE
Swedish
Immigrants from Pakistan
Median Male Earnings
Median Male Earnings Comparison
Swedes
Immigrants from Pakistan
$57,445
MEDIAN MALE EARNINGS
94.8/ 100
METRIC RATING
115th/ 347
METRIC RANK
$60,987
MEDIAN MALE EARNINGS
99.8/ 100
METRIC RATING
63rd/ 347
METRIC RANK
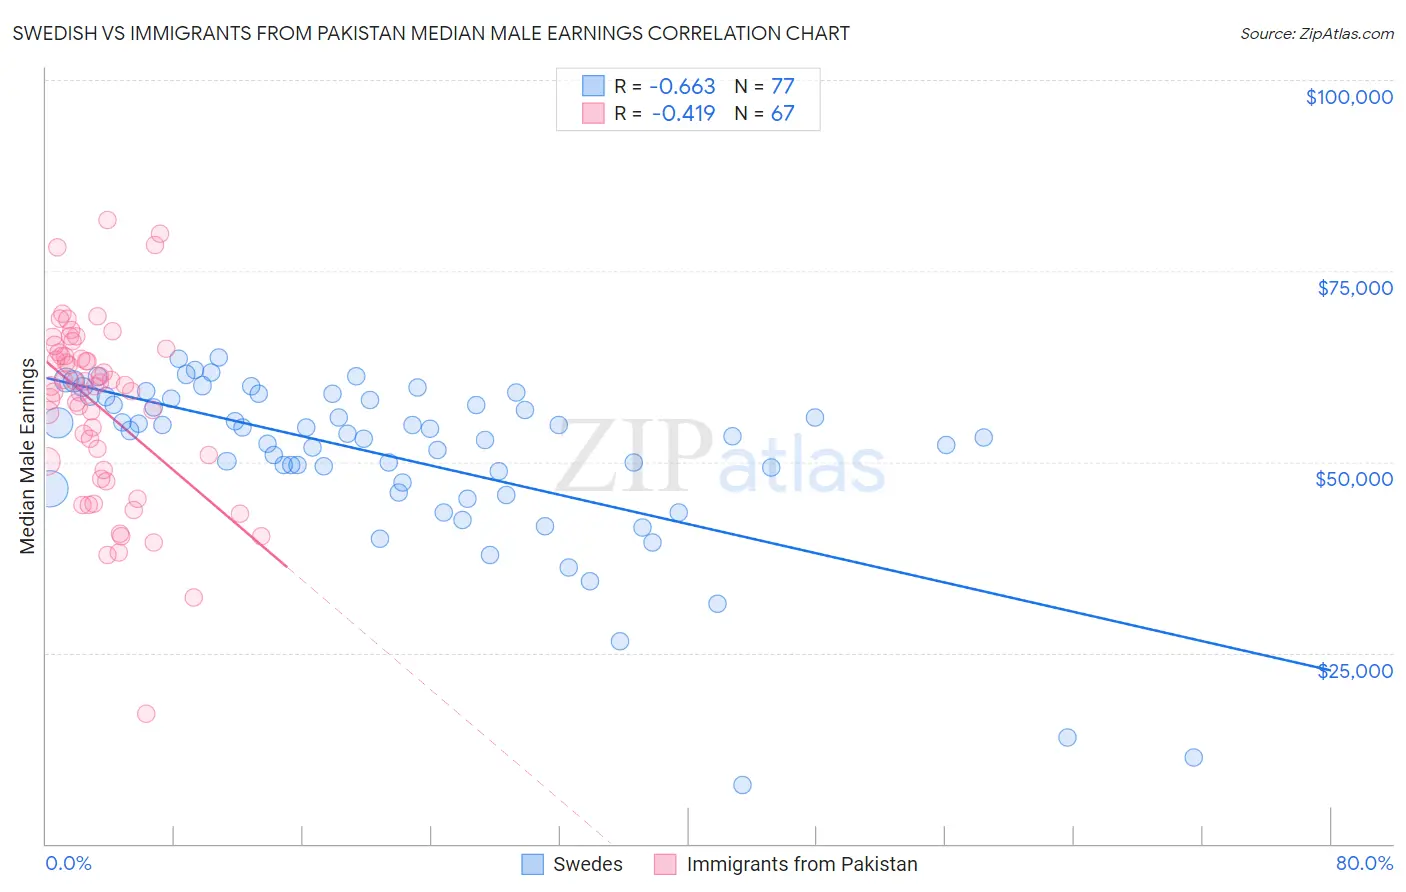
Swedish vs Immigrants from Pakistan Median Male Earnings Correlation Chart
The statistical analysis conducted on geographies consisting of 538,411,583 people shows a significant negative correlation between the proportion of Swedes and median male earnings in the United States with a correlation coefficient (R) of -0.663 and weighted average of $57,445. Similarly, the statistical analysis conducted on geographies consisting of 283,803,511 people shows a moderate negative correlation between the proportion of Immigrants from Pakistan and median male earnings in the United States with a correlation coefficient (R) of -0.419 and weighted average of $60,987, a difference of 6.2%.
Median Male Earnings Correlation Summary
| Measurement | Swedish | Immigrants from Pakistan |
| Minimum | $7,750 | $17,022 |
| Maximum | $63,730 | $81,734 |
| Range | $55,980 | $64,712 |
| Mean | $50,664 | $57,165 |
| Median | $53,721 | $59,890 |
| Interquartile 25% (IQ1) | $46,926 | $48,868 |
| Interquartile 75% (IQ3) | $58,399 | $64,399 |
| Interquartile Range (IQR) | $11,473 | $15,530 |
| Standard Deviation (Sample) | $11,170 | $11,844 |
| Standard Deviation (Population) | $11,097 | $11,755 |
Similar Demographics by Median Male Earnings
Demographics Similar to Swedes by Median Male Earnings
In terms of median male earnings, the demographic groups most similar to Swedes are Lebanese ($57,409, a difference of 0.060%), Immigrants from Zimbabwe ($57,352, a difference of 0.16%), Immigrants from Kuwait ($57,562, a difference of 0.20%), Carpatho Rusyn ($57,572, a difference of 0.22%), and Immigrants from Afghanistan ($57,582, a difference of 0.24%).
| Demographics | Rating | Rank | Median Male Earnings |
| Immigrants | Uzbekistan | 96.7 /100 | #108 | Exceptional $57,941 |
| British | 96.5 /100 | #109 | Exceptional $57,890 |
| Palestinians | 96.2 /100 | #110 | Exceptional $57,778 |
| Europeans | 95.6 /100 | #111 | Exceptional $57,637 |
| Immigrants | Afghanistan | 95.4 /100 | #112 | Exceptional $57,582 |
| Carpatho Rusyns | 95.3 /100 | #113 | Exceptional $57,572 |
| Immigrants | Kuwait | 95.3 /100 | #114 | Exceptional $57,562 |
| Swedes | 94.8 /100 | #115 | Exceptional $57,445 |
| Lebanese | 94.6 /100 | #116 | Exceptional $57,409 |
| Immigrants | Zimbabwe | 94.3 /100 | #117 | Exceptional $57,352 |
| Hungarians | 94.0 /100 | #118 | Exceptional $57,309 |
| Arabs | 94.0 /100 | #119 | Exceptional $57,298 |
| Canadians | 93.9 /100 | #120 | Exceptional $57,286 |
| Immigrants | Albania | 93.3 /100 | #121 | Exceptional $57,179 |
| Immigrants | Jordan | 93.1 /100 | #122 | Exceptional $57,145 |
Demographics Similar to Immigrants from Pakistan by Median Male Earnings
In terms of median male earnings, the demographic groups most similar to Immigrants from Pakistan are Immigrants from Eastern Europe ($60,958, a difference of 0.050%), Immigrants from Indonesia ($60,935, a difference of 0.080%), Immigrants from Romania ($61,040, a difference of 0.090%), Immigrants from Croatia ($60,914, a difference of 0.12%), and Bolivian ($61,066, a difference of 0.13%).
| Demographics | Rating | Rank | Median Male Earnings |
| Lithuanians | 99.9 /100 | #56 | Exceptional $61,228 |
| Immigrants | Scotland | 99.9 /100 | #57 | Exceptional $61,220 |
| New Zealanders | 99.9 /100 | #58 | Exceptional $61,199 |
| Immigrants | Netherlands | 99.8 /100 | #59 | Exceptional $61,096 |
| Egyptians | 99.8 /100 | #60 | Exceptional $61,095 |
| Bolivians | 99.8 /100 | #61 | Exceptional $61,066 |
| Immigrants | Romania | 99.8 /100 | #62 | Exceptional $61,040 |
| Immigrants | Pakistan | 99.8 /100 | #63 | Exceptional $60,987 |
| Immigrants | Eastern Europe | 99.8 /100 | #64 | Exceptional $60,958 |
| Immigrants | Indonesia | 99.8 /100 | #65 | Exceptional $60,935 |
| Immigrants | Croatia | 99.8 /100 | #66 | Exceptional $60,914 |
| Immigrants | Spain | 99.8 /100 | #67 | Exceptional $60,750 |
| Immigrants | Serbia | 99.7 /100 | #68 | Exceptional $60,600 |
| Immigrants | Canada | 99.7 /100 | #69 | Exceptional $60,388 |
| Immigrants | Bulgaria | 99.7 /100 | #70 | Exceptional $60,358 |