Immigrants from Middle Africa vs Romanian Median Male Earnings
COMPARE
Immigrants from Middle Africa
Romanian
Median Male Earnings
Median Male Earnings Comparison
Immigrants from Middle Africa
Romanians
$49,201
MEDIAN MALE EARNINGS
0.6/ 100
METRIC RATING
264th/ 347
METRIC RANK
$60,063
MEDIAN MALE EARNINGS
99.6/ 100
METRIC RATING
76th/ 347
METRIC RANK
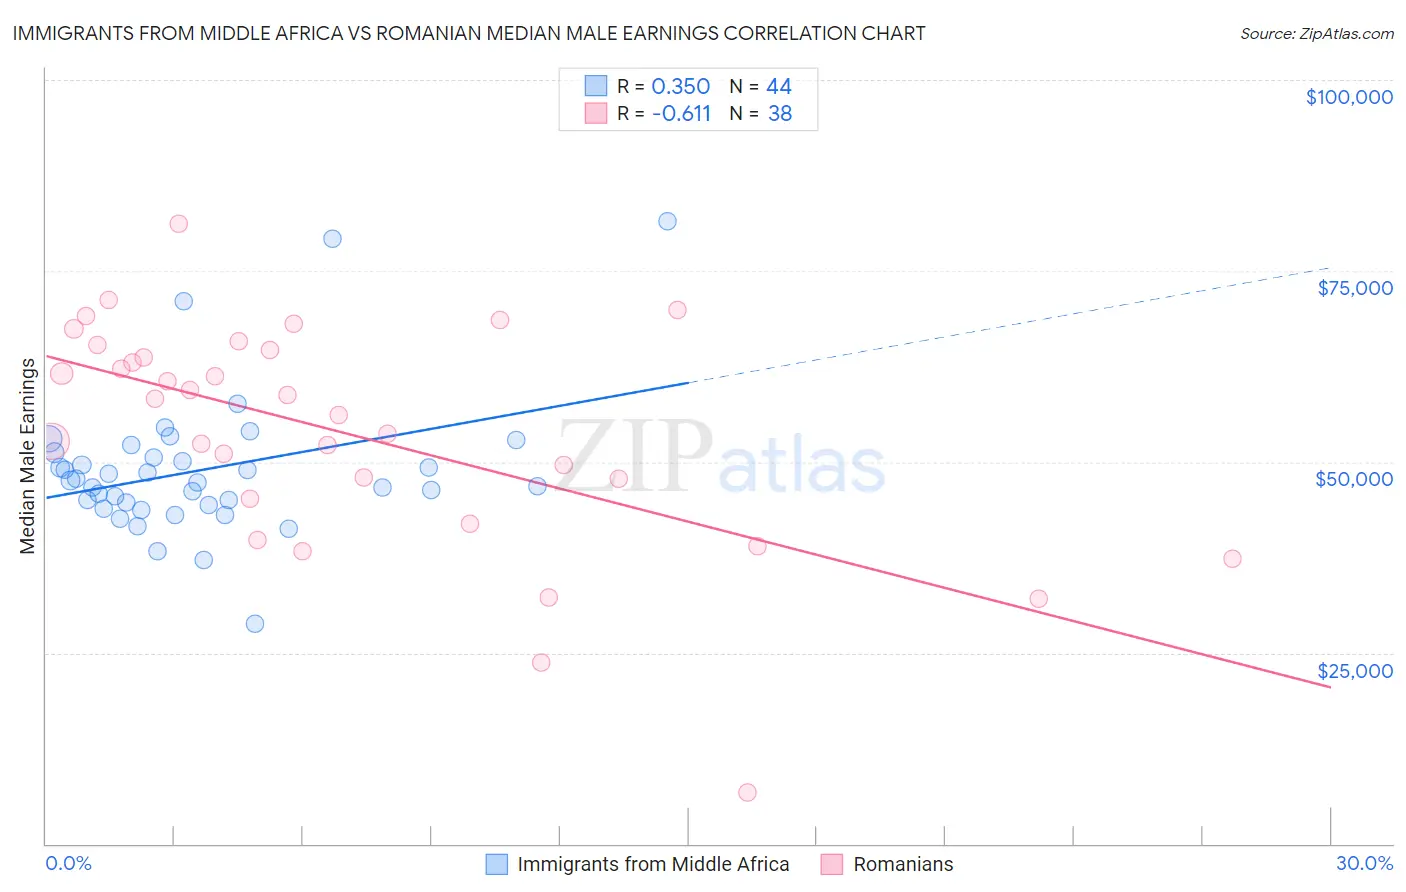
Immigrants from Middle Africa vs Romanian Median Male Earnings Correlation Chart
The statistical analysis conducted on geographies consisting of 202,728,043 people shows a mild positive correlation between the proportion of Immigrants from Middle Africa and median male earnings in the United States with a correlation coefficient (R) of 0.350 and weighted average of $49,201. Similarly, the statistical analysis conducted on geographies consisting of 377,805,375 people shows a significant negative correlation between the proportion of Romanians and median male earnings in the United States with a correlation coefficient (R) of -0.611 and weighted average of $60,063, a difference of 22.1%.
Median Male Earnings Correlation Summary
| Measurement | Immigrants from Middle Africa | Romanian |
| Minimum | $28,882 | $6,645 |
| Maximum | $81,458 | $81,155 |
| Range | $52,576 | $74,510 |
| Mean | $48,940 | $53,672 |
| Median | $47,419 | $57,202 |
| Interquartile 25% (IQ1) | $44,462 | $45,217 |
| Interquartile 75% (IQ3) | $50,890 | $64,624 |
| Interquartile Range (IQR) | $6,428 | $19,407 |
| Standard Deviation (Sample) | $9,309 | $15,023 |
| Standard Deviation (Population) | $9,202 | $14,824 |
Similar Demographics by Median Male Earnings
Demographics Similar to Immigrants from Middle Africa by Median Male Earnings
In terms of median male earnings, the demographic groups most similar to Immigrants from Middle Africa are Immigrants from Laos ($49,190, a difference of 0.020%), Nicaraguan ($49,215, a difference of 0.030%), Immigrants from West Indies ($49,271, a difference of 0.14%), Liberian ($49,318, a difference of 0.24%), and Iroquois ($49,374, a difference of 0.35%).
| Demographics | Rating | Rank | Median Male Earnings |
| British West Indians | 0.8 /100 | #257 | Tragic $49,636 |
| Cree | 0.7 /100 | #258 | Tragic $49,497 |
| Nepalese | 0.7 /100 | #259 | Tragic $49,458 |
| Iroquois | 0.7 /100 | #260 | Tragic $49,374 |
| Liberians | 0.6 /100 | #261 | Tragic $49,318 |
| Immigrants | West Indies | 0.6 /100 | #262 | Tragic $49,271 |
| Nicaraguans | 0.6 /100 | #263 | Tragic $49,215 |
| Immigrants | Middle Africa | 0.6 /100 | #264 | Tragic $49,201 |
| Immigrants | Laos | 0.6 /100 | #265 | Tragic $49,190 |
| Somalis | 0.5 /100 | #266 | Tragic $49,025 |
| Spanish Americans | 0.5 /100 | #267 | Tragic $49,008 |
| Ute | 0.4 /100 | #268 | Tragic $48,899 |
| Tsimshian | 0.4 /100 | #269 | Tragic $48,836 |
| Potawatomi | 0.4 /100 | #270 | Tragic $48,768 |
| Cherokee | 0.3 /100 | #271 | Tragic $48,669 |
Demographics Similar to Romanians by Median Male Earnings
In terms of median male earnings, the demographic groups most similar to Romanians are Immigrants from Bolivia ($60,088, a difference of 0.040%), Argentinean ($60,117, a difference of 0.090%), Paraguayan ($59,975, a difference of 0.15%), Immigrants from Egypt ($59,925, a difference of 0.23%), and Immigrants from North America ($60,265, a difference of 0.34%).
| Demographics | Rating | Rank | Median Male Earnings |
| Immigrants | Canada | 99.7 /100 | #69 | Exceptional $60,388 |
| Immigrants | Bulgaria | 99.7 /100 | #70 | Exceptional $60,358 |
| Mongolians | 99.7 /100 | #71 | Exceptional $60,350 |
| Immigrants | Western Europe | 99.7 /100 | #72 | Exceptional $60,334 |
| Immigrants | North America | 99.7 /100 | #73 | Exceptional $60,265 |
| Argentineans | 99.6 /100 | #74 | Exceptional $60,117 |
| Immigrants | Bolivia | 99.6 /100 | #75 | Exceptional $60,088 |
| Romanians | 99.6 /100 | #76 | Exceptional $60,063 |
| Paraguayans | 99.5 /100 | #77 | Exceptional $59,975 |
| Immigrants | Egypt | 99.5 /100 | #78 | Exceptional $59,925 |
| Immigrants | Ukraine | 99.5 /100 | #79 | Exceptional $59,820 |
| Immigrants | Hungary | 99.5 /100 | #80 | Exceptional $59,806 |
| Ukrainians | 99.4 /100 | #81 | Exceptional $59,728 |
| Croatians | 99.4 /100 | #82 | Exceptional $59,715 |
| Immigrants | Italy | 99.4 /100 | #83 | Exceptional $59,691 |