Burmese vs Romanian Median Male Earnings
COMPARE
Burmese
Romanian
Median Male Earnings
Median Male Earnings Comparison
Burmese
Romanians
$65,236
MEDIAN MALE EARNINGS
100.0/ 100
METRIC RATING
22nd/ 347
METRIC RANK
$60,063
MEDIAN MALE EARNINGS
99.6/ 100
METRIC RATING
76th/ 347
METRIC RANK
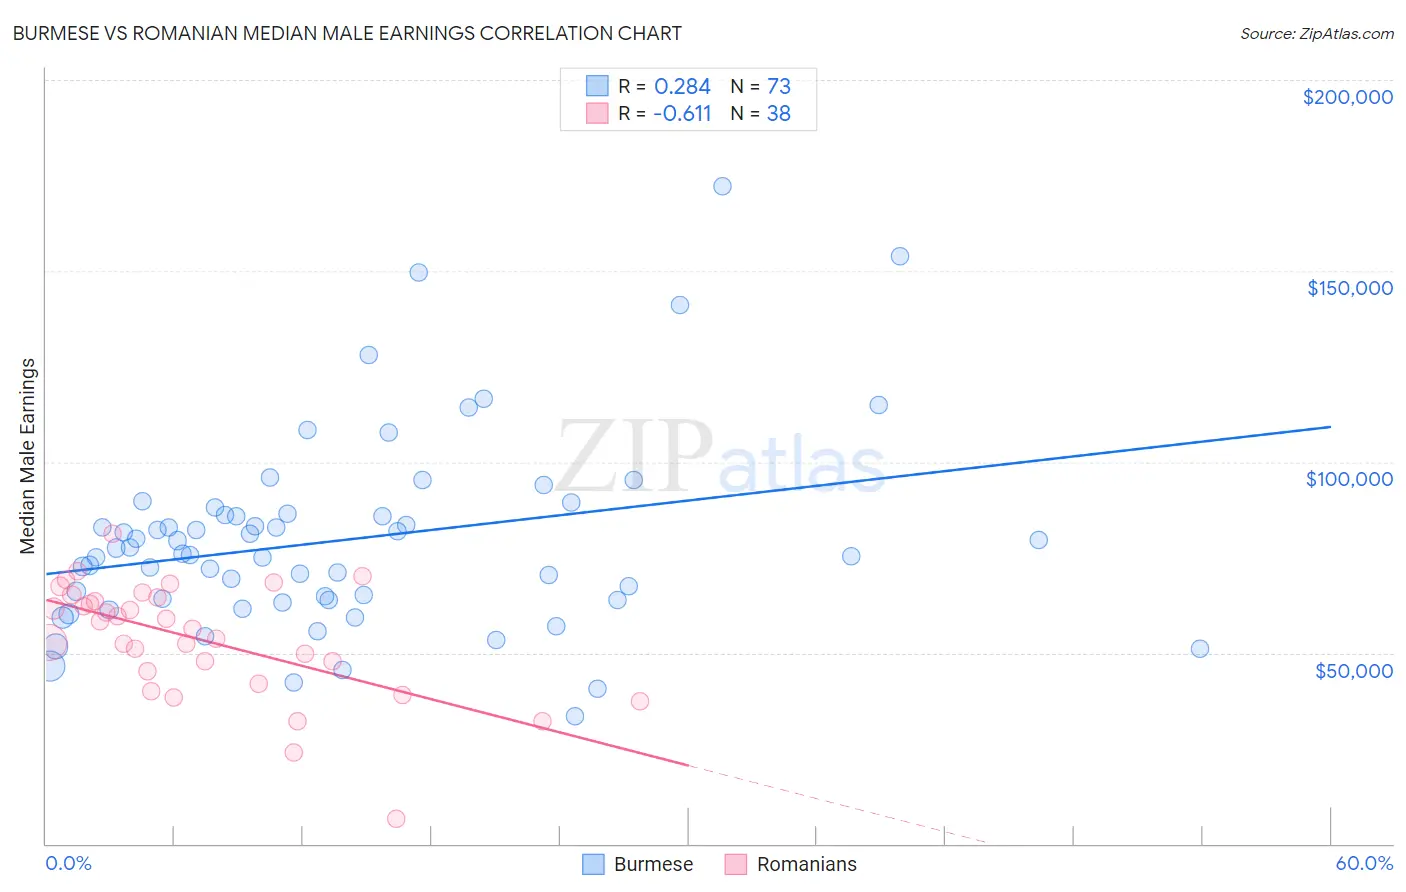
Burmese vs Romanian Median Male Earnings Correlation Chart
The statistical analysis conducted on geographies consisting of 465,224,564 people shows a weak positive correlation between the proportion of Burmese and median male earnings in the United States with a correlation coefficient (R) of 0.284 and weighted average of $65,236. Similarly, the statistical analysis conducted on geographies consisting of 377,805,375 people shows a significant negative correlation between the proportion of Romanians and median male earnings in the United States with a correlation coefficient (R) of -0.611 and weighted average of $60,063, a difference of 8.6%.
Median Male Earnings Correlation Summary
| Measurement | Burmese | Romanian |
| Minimum | $33,399 | $6,645 |
| Maximum | $172,143 | $81,155 |
| Range | $138,744 | $74,510 |
| Mean | $79,644 | $53,672 |
| Median | $75,943 | $57,202 |
| Interquartile 25% (IQ1) | $63,717 | $45,217 |
| Interquartile 75% (IQ3) | $86,383 | $64,624 |
| Interquartile Range (IQR) | $22,666 | $19,407 |
| Standard Deviation (Sample) | $25,713 | $15,023 |
| Standard Deviation (Population) | $25,536 | $14,824 |
Similar Demographics by Median Male Earnings
Demographics Similar to Burmese by Median Male Earnings
In terms of median male earnings, the demographic groups most similar to Burmese are Immigrants from Korea ($65,079, a difference of 0.24%), Immigrants from Sweden ($65,406, a difference of 0.26%), Immigrants from Northern Europe ($64,987, a difference of 0.38%), Immigrants from Japan ($65,518, a difference of 0.43%), and Cypriot ($65,549, a difference of 0.48%).
| Demographics | Rating | Rank | Median Male Earnings |
| Immigrants | Eastern Asia | 100.0 /100 | #15 | Exceptional $66,903 |
| Eastern Europeans | 100.0 /100 | #16 | Exceptional $66,472 |
| Immigrants | Belgium | 100.0 /100 | #17 | Exceptional $66,125 |
| Indians (Asian) | 100.0 /100 | #18 | Exceptional $66,078 |
| Cypriots | 100.0 /100 | #19 | Exceptional $65,549 |
| Immigrants | Japan | 100.0 /100 | #20 | Exceptional $65,518 |
| Immigrants | Sweden | 100.0 /100 | #21 | Exceptional $65,406 |
| Burmese | 100.0 /100 | #22 | Exceptional $65,236 |
| Immigrants | Korea | 100.0 /100 | #23 | Exceptional $65,079 |
| Immigrants | Northern Europe | 100.0 /100 | #24 | Exceptional $64,987 |
| Immigrants | Denmark | 100.0 /100 | #25 | Exceptional $64,625 |
| Turks | 100.0 /100 | #26 | Exceptional $64,253 |
| Immigrants | Switzerland | 100.0 /100 | #27 | Exceptional $63,944 |
| Russians | 100.0 /100 | #28 | Exceptional $63,939 |
| Asians | 100.0 /100 | #29 | Exceptional $63,827 |
Demographics Similar to Romanians by Median Male Earnings
In terms of median male earnings, the demographic groups most similar to Romanians are Immigrants from Bolivia ($60,088, a difference of 0.040%), Argentinean ($60,117, a difference of 0.090%), Paraguayan ($59,975, a difference of 0.15%), Immigrants from Egypt ($59,925, a difference of 0.23%), and Immigrants from North America ($60,265, a difference of 0.34%).
| Demographics | Rating | Rank | Median Male Earnings |
| Immigrants | Canada | 99.7 /100 | #69 | Exceptional $60,388 |
| Immigrants | Bulgaria | 99.7 /100 | #70 | Exceptional $60,358 |
| Mongolians | 99.7 /100 | #71 | Exceptional $60,350 |
| Immigrants | Western Europe | 99.7 /100 | #72 | Exceptional $60,334 |
| Immigrants | North America | 99.7 /100 | #73 | Exceptional $60,265 |
| Argentineans | 99.6 /100 | #74 | Exceptional $60,117 |
| Immigrants | Bolivia | 99.6 /100 | #75 | Exceptional $60,088 |
| Romanians | 99.6 /100 | #76 | Exceptional $60,063 |
| Paraguayans | 99.5 /100 | #77 | Exceptional $59,975 |
| Immigrants | Egypt | 99.5 /100 | #78 | Exceptional $59,925 |
| Immigrants | Ukraine | 99.5 /100 | #79 | Exceptional $59,820 |
| Immigrants | Hungary | 99.5 /100 | #80 | Exceptional $59,806 |
| Ukrainians | 99.4 /100 | #81 | Exceptional $59,728 |
| Croatians | 99.4 /100 | #82 | Exceptional $59,715 |
| Immigrants | Italy | 99.4 /100 | #83 | Exceptional $59,691 |