Immigrants from Grenada vs Romanian Median Male Earnings
COMPARE
Immigrants from Grenada
Romanian
Median Male Earnings
Median Male Earnings Comparison
Immigrants from Grenada
Romanians
$50,279
MEDIAN MALE EARNINGS
1.6/ 100
METRIC RATING
251st/ 347
METRIC RANK
$60,063
MEDIAN MALE EARNINGS
99.6/ 100
METRIC RATING
76th/ 347
METRIC RANK
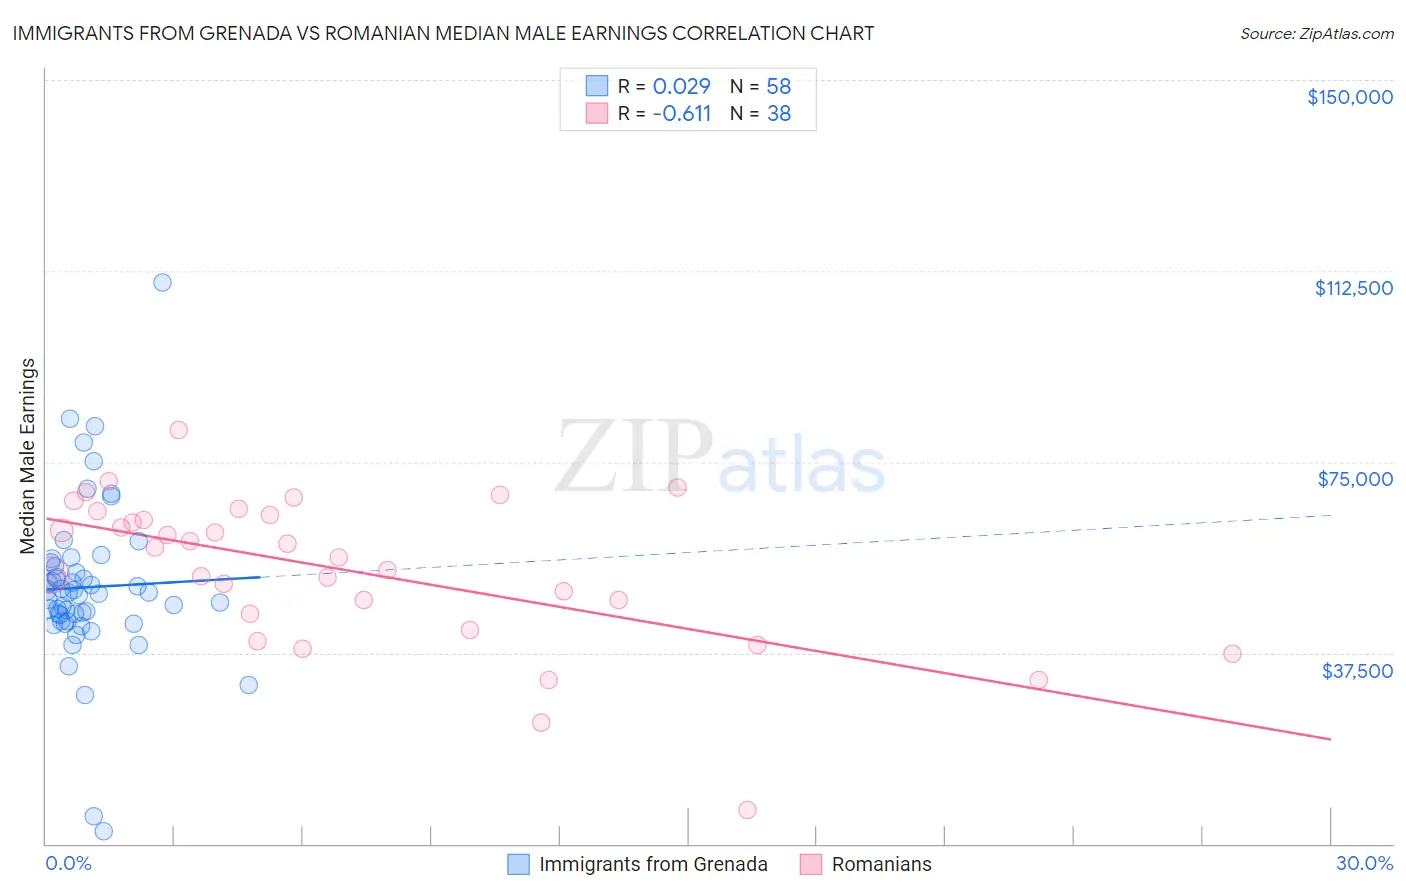
Immigrants from Grenada vs Romanian Median Male Earnings Correlation Chart
The statistical analysis conducted on geographies consisting of 67,198,306 people shows no correlation between the proportion of Immigrants from Grenada and median male earnings in the United States with a correlation coefficient (R) of 0.029 and weighted average of $50,279. Similarly, the statistical analysis conducted on geographies consisting of 377,805,375 people shows a significant negative correlation between the proportion of Romanians and median male earnings in the United States with a correlation coefficient (R) of -0.611 and weighted average of $60,063, a difference of 19.5%.
Median Male Earnings Correlation Summary
| Measurement | Immigrants from Grenada | Romanian |
| Minimum | $2,499 | $6,645 |
| Maximum | $110,313 | $81,155 |
| Range | $107,814 | $74,510 |
| Mean | $50,381 | $53,672 |
| Median | $49,246 | $57,202 |
| Interquartile 25% (IQ1) | $43,797 | $45,217 |
| Interquartile 75% (IQ3) | $54,582 | $64,624 |
| Interquartile Range (IQR) | $10,785 | $19,407 |
| Standard Deviation (Sample) | $16,114 | $15,023 |
| Standard Deviation (Population) | $15,975 | $14,824 |
Similar Demographics by Median Male Earnings
Demographics Similar to Immigrants from Grenada by Median Male Earnings
In terms of median male earnings, the demographic groups most similar to Immigrants from Grenada are Osage ($50,292, a difference of 0.020%), Immigrants from Burma/Myanmar ($50,298, a difference of 0.040%), Immigrants from Guyana ($50,321, a difference of 0.080%), Subsaharan African ($50,408, a difference of 0.26%), and Immigrants from Ecuador ($50,474, a difference of 0.39%).
| Demographics | Rating | Rank | Median Male Earnings |
| Houma | 2.0 /100 | #244 | Tragic $50,547 |
| Hawaiians | 1.9 /100 | #245 | Tragic $50,488 |
| Immigrants | Ecuador | 1.9 /100 | #246 | Tragic $50,474 |
| Sub-Saharan Africans | 1.8 /100 | #247 | Tragic $50,408 |
| Immigrants | Guyana | 1.6 /100 | #248 | Tragic $50,321 |
| Immigrants | Burma/Myanmar | 1.6 /100 | #249 | Tragic $50,298 |
| Osage | 1.6 /100 | #250 | Tragic $50,292 |
| Immigrants | Grenada | 1.6 /100 | #251 | Tragic $50,279 |
| Immigrants | Cabo Verde | 1.2 /100 | #252 | Tragic $50,009 |
| German Russians | 1.1 /100 | #253 | Tragic $49,924 |
| Senegalese | 1.0 /100 | #254 | Tragic $49,774 |
| Alaskan Athabascans | 0.9 /100 | #255 | Tragic $49,748 |
| Alaska Natives | 0.9 /100 | #256 | Tragic $49,711 |
| British West Indians | 0.8 /100 | #257 | Tragic $49,636 |
| Cree | 0.7 /100 | #258 | Tragic $49,497 |
Demographics Similar to Romanians by Median Male Earnings
In terms of median male earnings, the demographic groups most similar to Romanians are Immigrants from Bolivia ($60,088, a difference of 0.040%), Argentinean ($60,117, a difference of 0.090%), Paraguayan ($59,975, a difference of 0.15%), Immigrants from Egypt ($59,925, a difference of 0.23%), and Immigrants from North America ($60,265, a difference of 0.34%).
| Demographics | Rating | Rank | Median Male Earnings |
| Immigrants | Canada | 99.7 /100 | #69 | Exceptional $60,388 |
| Immigrants | Bulgaria | 99.7 /100 | #70 | Exceptional $60,358 |
| Mongolians | 99.7 /100 | #71 | Exceptional $60,350 |
| Immigrants | Western Europe | 99.7 /100 | #72 | Exceptional $60,334 |
| Immigrants | North America | 99.7 /100 | #73 | Exceptional $60,265 |
| Argentineans | 99.6 /100 | #74 | Exceptional $60,117 |
| Immigrants | Bolivia | 99.6 /100 | #75 | Exceptional $60,088 |
| Romanians | 99.6 /100 | #76 | Exceptional $60,063 |
| Paraguayans | 99.5 /100 | #77 | Exceptional $59,975 |
| Immigrants | Egypt | 99.5 /100 | #78 | Exceptional $59,925 |
| Immigrants | Ukraine | 99.5 /100 | #79 | Exceptional $59,820 |
| Immigrants | Hungary | 99.5 /100 | #80 | Exceptional $59,806 |
| Ukrainians | 99.4 /100 | #81 | Exceptional $59,728 |
| Croatians | 99.4 /100 | #82 | Exceptional $59,715 |
| Immigrants | Italy | 99.4 /100 | #83 | Exceptional $59,691 |