Swedish vs Aleut Median Male Earnings
COMPARE
Swedish
Aleut
Median Male Earnings
Median Male Earnings Comparison
Swedes
Aleuts
$57,445
MEDIAN MALE EARNINGS
94.8/ 100
METRIC RATING
115th/ 347
METRIC RANK
$51,168
MEDIAN MALE EARNINGS
3.7/ 100
METRIC RATING
233rd/ 347
METRIC RANK
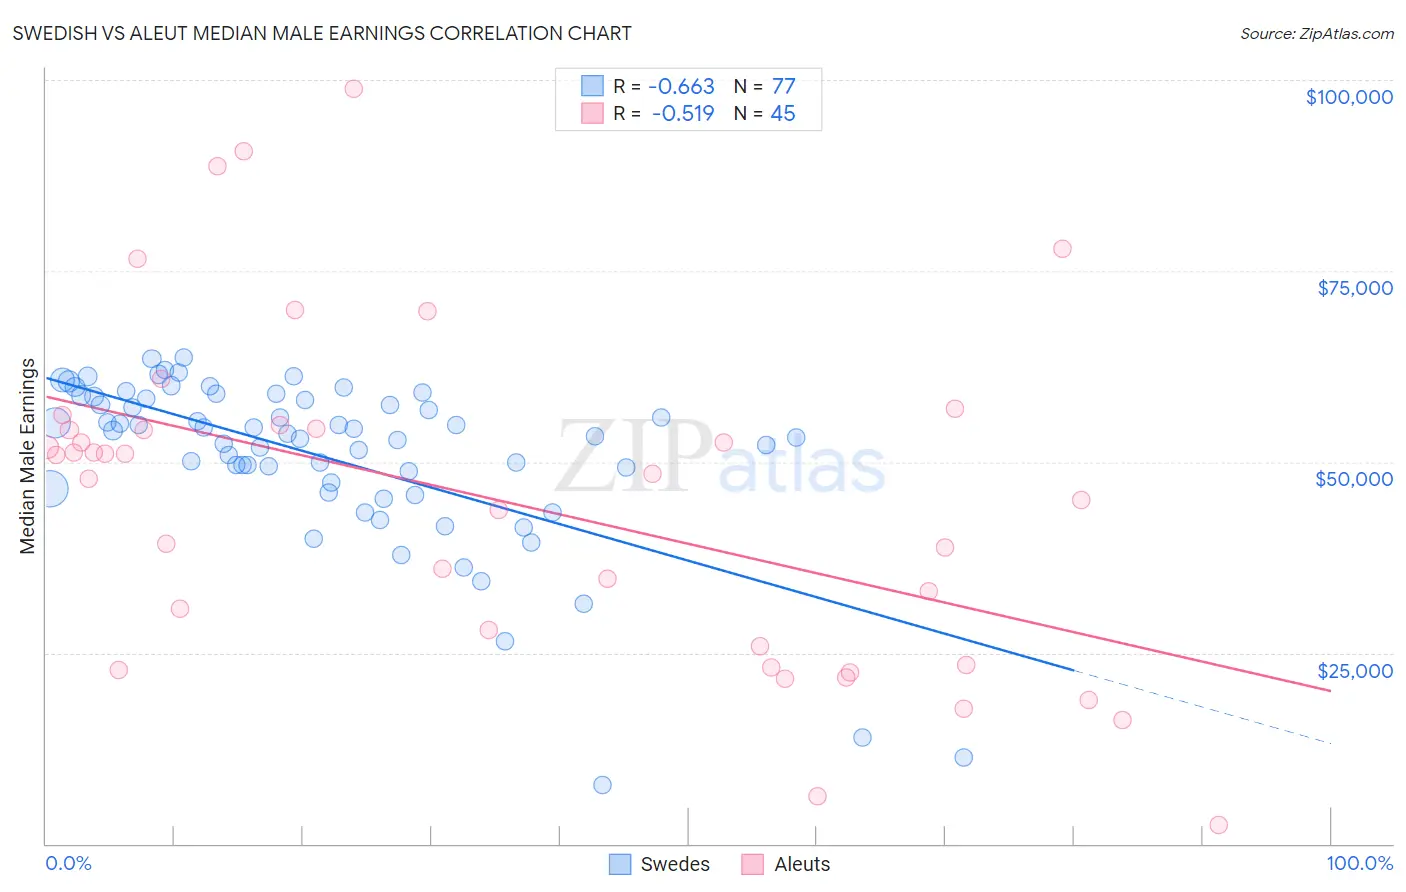
Swedish vs Aleut Median Male Earnings Correlation Chart
The statistical analysis conducted on geographies consisting of 538,411,583 people shows a significant negative correlation between the proportion of Swedes and median male earnings in the United States with a correlation coefficient (R) of -0.663 and weighted average of $57,445. Similarly, the statistical analysis conducted on geographies consisting of 61,765,699 people shows a substantial negative correlation between the proportion of Aleuts and median male earnings in the United States with a correlation coefficient (R) of -0.519 and weighted average of $51,168, a difference of 12.3%.
Median Male Earnings Correlation Summary
| Measurement | Swedish | Aleut |
| Minimum | $7,750 | $2,499 |
| Maximum | $63,730 | $98,906 |
| Range | $55,980 | $96,407 |
| Mean | $50,664 | $44,984 |
| Median | $53,721 | $48,500 |
| Interquartile 25% (IQ1) | $46,926 | $24,583 |
| Interquartile 75% (IQ3) | $58,399 | $54,582 |
| Interquartile Range (IQR) | $11,473 | $29,999 |
| Standard Deviation (Sample) | $11,170 | $22,008 |
| Standard Deviation (Population) | $11,097 | $21,762 |
Similar Demographics by Median Male Earnings
Demographics Similar to Swedes by Median Male Earnings
In terms of median male earnings, the demographic groups most similar to Swedes are Lebanese ($57,409, a difference of 0.060%), Immigrants from Zimbabwe ($57,352, a difference of 0.16%), Immigrants from Kuwait ($57,562, a difference of 0.20%), Carpatho Rusyn ($57,572, a difference of 0.22%), and Immigrants from Afghanistan ($57,582, a difference of 0.24%).
| Demographics | Rating | Rank | Median Male Earnings |
| Immigrants | Uzbekistan | 96.7 /100 | #108 | Exceptional $57,941 |
| British | 96.5 /100 | #109 | Exceptional $57,890 |
| Palestinians | 96.2 /100 | #110 | Exceptional $57,778 |
| Europeans | 95.6 /100 | #111 | Exceptional $57,637 |
| Immigrants | Afghanistan | 95.4 /100 | #112 | Exceptional $57,582 |
| Carpatho Rusyns | 95.3 /100 | #113 | Exceptional $57,572 |
| Immigrants | Kuwait | 95.3 /100 | #114 | Exceptional $57,562 |
| Swedes | 94.8 /100 | #115 | Exceptional $57,445 |
| Lebanese | 94.6 /100 | #116 | Exceptional $57,409 |
| Immigrants | Zimbabwe | 94.3 /100 | #117 | Exceptional $57,352 |
| Hungarians | 94.0 /100 | #118 | Exceptional $57,309 |
| Arabs | 94.0 /100 | #119 | Exceptional $57,298 |
| Canadians | 93.9 /100 | #120 | Exceptional $57,286 |
| Immigrants | Albania | 93.3 /100 | #121 | Exceptional $57,179 |
| Immigrants | Jordan | 93.1 /100 | #122 | Exceptional $57,145 |
Demographics Similar to Aleuts by Median Male Earnings
In terms of median male earnings, the demographic groups most similar to Aleuts are Sudanese ($51,216, a difference of 0.090%), Barbadian ($51,236, a difference of 0.13%), Cape Verdean ($51,103, a difference of 0.13%), Immigrants from Nigeria ($51,310, a difference of 0.28%), and Immigrants from Trinidad and Tobago ($51,376, a difference of 0.41%).
| Demographics | Rating | Rank | Median Male Earnings |
| Japanese | 4.9 /100 | #226 | Tragic $51,473 |
| Trinidadians and Tobagonians | 4.8 /100 | #227 | Tragic $51,446 |
| Samoans | 4.6 /100 | #228 | Tragic $51,389 |
| Immigrants | Trinidad and Tobago | 4.5 /100 | #229 | Tragic $51,376 |
| Immigrants | Nigeria | 4.2 /100 | #230 | Tragic $51,310 |
| Barbadians | 3.9 /100 | #231 | Tragic $51,236 |
| Sudanese | 3.9 /100 | #232 | Tragic $51,216 |
| Aleuts | 3.7 /100 | #233 | Tragic $51,168 |
| Cape Verdeans | 3.5 /100 | #234 | Tragic $51,103 |
| Immigrants | Western Africa | 3.0 /100 | #235 | Tragic $50,940 |
| Pennsylvania Germans | 2.8 /100 | #236 | Tragic $50,878 |
| Immigrants | Barbados | 2.6 /100 | #237 | Tragic $50,795 |
| Malaysians | 2.5 /100 | #238 | Tragic $50,772 |
| Americans | 2.5 /100 | #239 | Tragic $50,761 |
| West Indians | 2.3 /100 | #240 | Tragic $50,682 |