Somali vs Romanian Median Male Earnings
COMPARE
Somali
Romanian
Median Male Earnings
Median Male Earnings Comparison
Somalis
Romanians
$49,025
MEDIAN MALE EARNINGS
0.5/ 100
METRIC RATING
266th/ 347
METRIC RANK
$60,063
MEDIAN MALE EARNINGS
99.6/ 100
METRIC RATING
76th/ 347
METRIC RANK
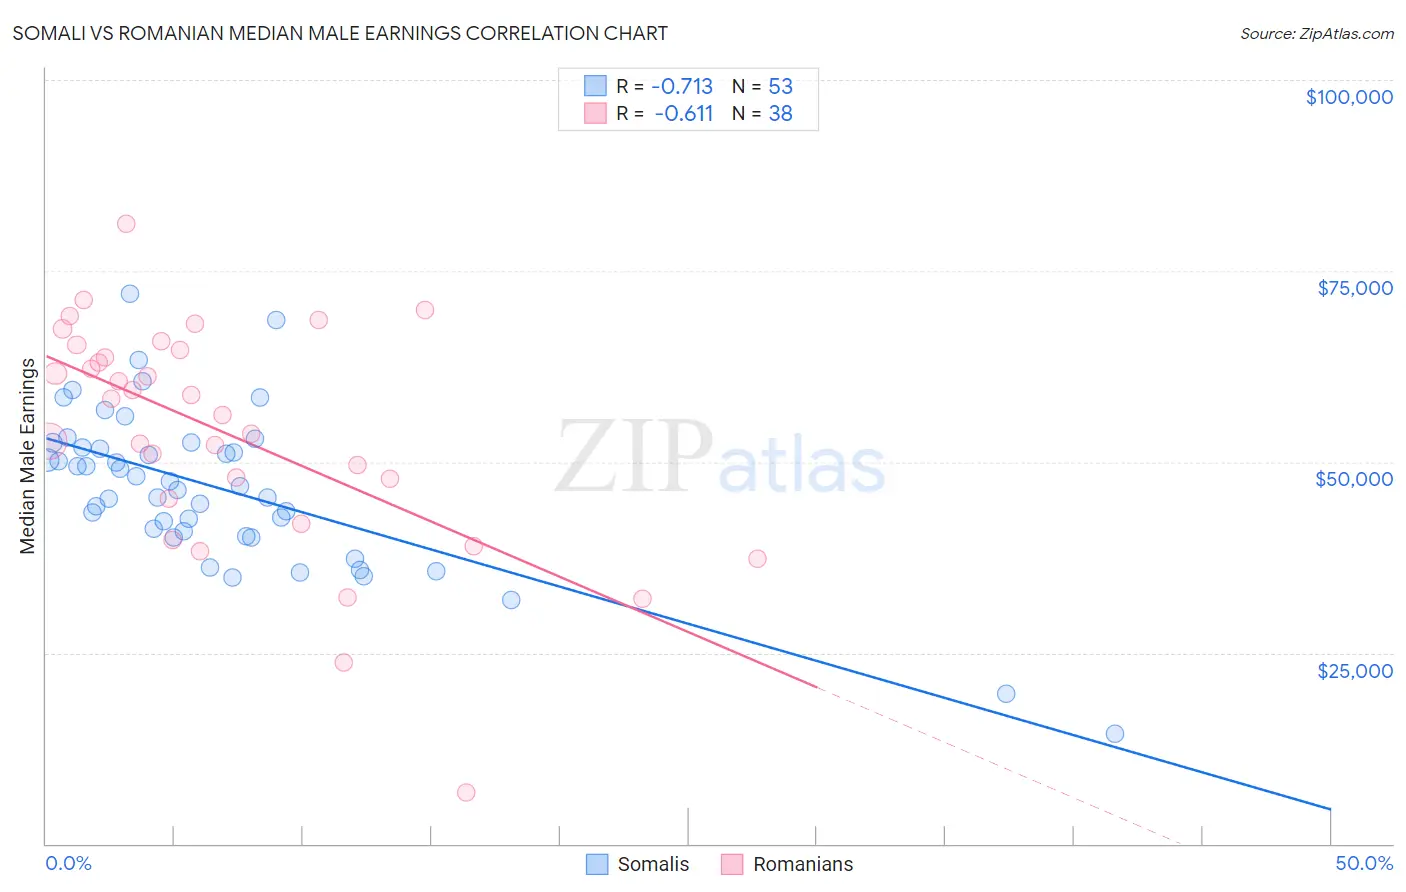
Somali vs Romanian Median Male Earnings Correlation Chart
The statistical analysis conducted on geographies consisting of 99,323,068 people shows a strong negative correlation between the proportion of Somalis and median male earnings in the United States with a correlation coefficient (R) of -0.713 and weighted average of $49,025. Similarly, the statistical analysis conducted on geographies consisting of 377,805,375 people shows a significant negative correlation between the proportion of Romanians and median male earnings in the United States with a correlation coefficient (R) of -0.611 and weighted average of $60,063, a difference of 22.5%.
Median Male Earnings Correlation Summary
| Measurement | Somali | Romanian |
| Minimum | $14,382 | $6,645 |
| Maximum | $71,947 | $81,155 |
| Range | $57,565 | $74,510 |
| Mean | $46,539 | $53,672 |
| Median | $46,803 | $57,202 |
| Interquartile 25% (IQ1) | $40,598 | $45,217 |
| Interquartile 75% (IQ3) | $52,221 | $64,624 |
| Interquartile Range (IQR) | $11,623 | $19,407 |
| Standard Deviation (Sample) | $10,412 | $15,023 |
| Standard Deviation (Population) | $10,313 | $14,824 |
Similar Demographics by Median Male Earnings
Demographics Similar to Somalis by Median Male Earnings
In terms of median male earnings, the demographic groups most similar to Somalis are Spanish American ($49,008, a difference of 0.040%), Ute ($48,899, a difference of 0.26%), Immigrants from Laos ($49,190, a difference of 0.34%), Immigrants from Middle Africa ($49,201, a difference of 0.36%), and Nicaraguan ($49,215, a difference of 0.39%).
| Demographics | Rating | Rank | Median Male Earnings |
| Nepalese | 0.7 /100 | #259 | Tragic $49,458 |
| Iroquois | 0.7 /100 | #260 | Tragic $49,374 |
| Liberians | 0.6 /100 | #261 | Tragic $49,318 |
| Immigrants | West Indies | 0.6 /100 | #262 | Tragic $49,271 |
| Nicaraguans | 0.6 /100 | #263 | Tragic $49,215 |
| Immigrants | Middle Africa | 0.6 /100 | #264 | Tragic $49,201 |
| Immigrants | Laos | 0.6 /100 | #265 | Tragic $49,190 |
| Somalis | 0.5 /100 | #266 | Tragic $49,025 |
| Spanish Americans | 0.5 /100 | #267 | Tragic $49,008 |
| Ute | 0.4 /100 | #268 | Tragic $48,899 |
| Tsimshian | 0.4 /100 | #269 | Tragic $48,836 |
| Potawatomi | 0.4 /100 | #270 | Tragic $48,768 |
| Cherokee | 0.3 /100 | #271 | Tragic $48,669 |
| Salvadorans | 0.3 /100 | #272 | Tragic $48,646 |
| Jamaicans | 0.3 /100 | #273 | Tragic $48,632 |
Demographics Similar to Romanians by Median Male Earnings
In terms of median male earnings, the demographic groups most similar to Romanians are Immigrants from Bolivia ($60,088, a difference of 0.040%), Argentinean ($60,117, a difference of 0.090%), Paraguayan ($59,975, a difference of 0.15%), Immigrants from Egypt ($59,925, a difference of 0.23%), and Immigrants from North America ($60,265, a difference of 0.34%).
| Demographics | Rating | Rank | Median Male Earnings |
| Immigrants | Canada | 99.7 /100 | #69 | Exceptional $60,388 |
| Immigrants | Bulgaria | 99.7 /100 | #70 | Exceptional $60,358 |
| Mongolians | 99.7 /100 | #71 | Exceptional $60,350 |
| Immigrants | Western Europe | 99.7 /100 | #72 | Exceptional $60,334 |
| Immigrants | North America | 99.7 /100 | #73 | Exceptional $60,265 |
| Argentineans | 99.6 /100 | #74 | Exceptional $60,117 |
| Immigrants | Bolivia | 99.6 /100 | #75 | Exceptional $60,088 |
| Romanians | 99.6 /100 | #76 | Exceptional $60,063 |
| Paraguayans | 99.5 /100 | #77 | Exceptional $59,975 |
| Immigrants | Egypt | 99.5 /100 | #78 | Exceptional $59,925 |
| Immigrants | Ukraine | 99.5 /100 | #79 | Exceptional $59,820 |
| Immigrants | Hungary | 99.5 /100 | #80 | Exceptional $59,806 |
| Ukrainians | 99.4 /100 | #81 | Exceptional $59,728 |
| Croatians | 99.4 /100 | #82 | Exceptional $59,715 |
| Immigrants | Italy | 99.4 /100 | #83 | Exceptional $59,691 |