Ukrainian vs Romanian Median Male Earnings
COMPARE
Ukrainian
Romanian
Median Male Earnings
Median Male Earnings Comparison
Ukrainians
Romanians
$59,728
MEDIAN MALE EARNINGS
99.4/ 100
METRIC RATING
81st/ 347
METRIC RANK
$60,063
MEDIAN MALE EARNINGS
99.6/ 100
METRIC RATING
76th/ 347
METRIC RANK
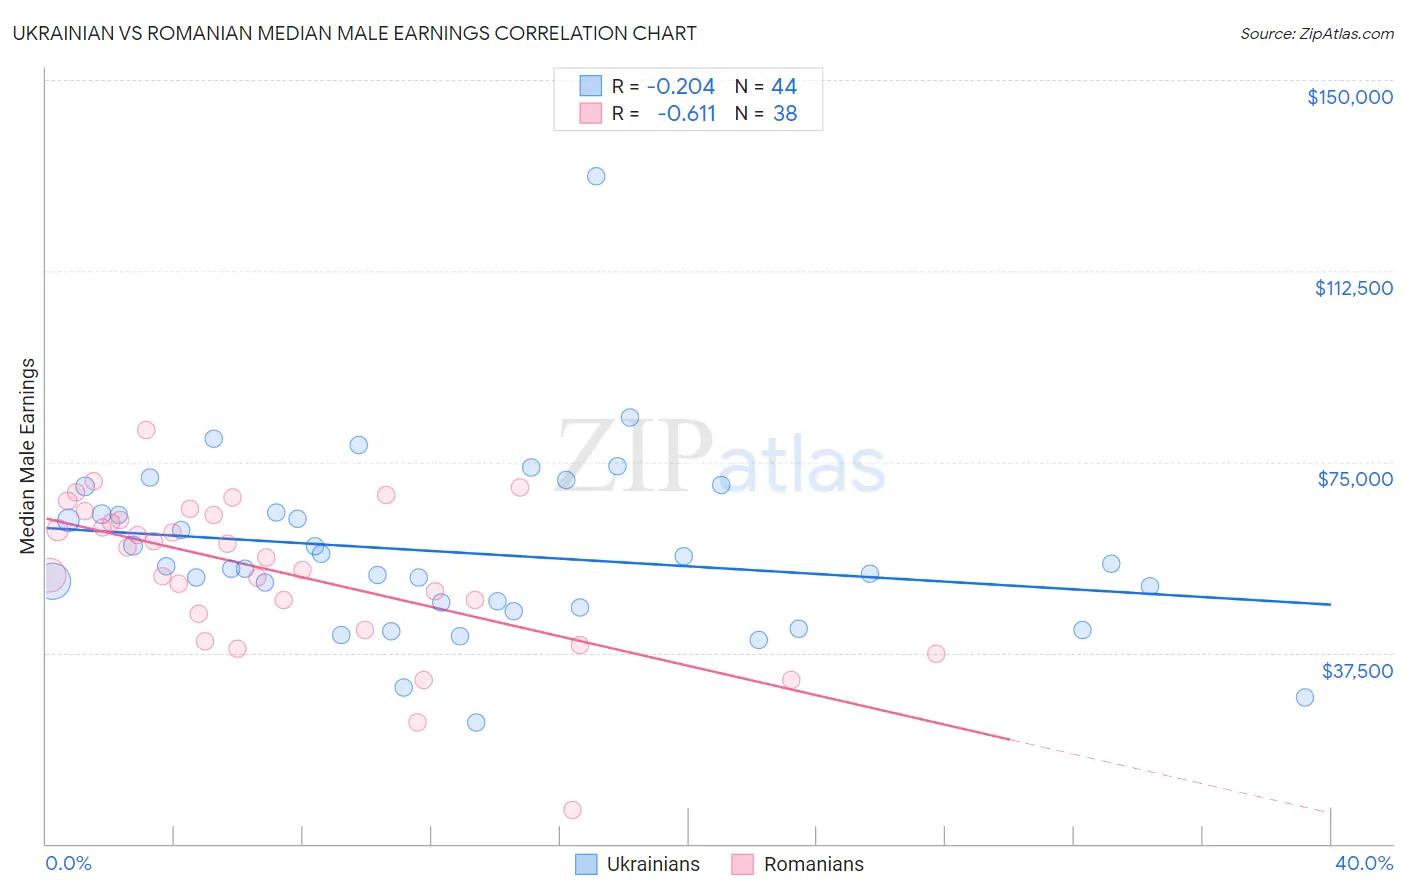
Ukrainian vs Romanian Median Male Earnings Correlation Chart
The statistical analysis conducted on geographies consisting of 448,432,137 people shows a weak negative correlation between the proportion of Ukrainians and median male earnings in the United States with a correlation coefficient (R) of -0.204 and weighted average of $59,728. Similarly, the statistical analysis conducted on geographies consisting of 377,805,375 people shows a significant negative correlation between the proportion of Romanians and median male earnings in the United States with a correlation coefficient (R) of -0.611 and weighted average of $60,063, a difference of 0.56%.
Median Male Earnings Correlation Summary
| Measurement | Ukrainian | Romanian |
| Minimum | $23,696 | $6,645 |
| Maximum | $131,091 | $81,155 |
| Range | $107,394 | $74,510 |
| Mean | $57,214 | $53,672 |
| Median | $54,259 | $57,202 |
| Interquartile 25% (IQ1) | $46,850 | $45,217 |
| Interquartile 75% (IQ3) | $64,861 | $64,624 |
| Interquartile Range (IQR) | $18,011 | $19,407 |
| Standard Deviation (Sample) | $17,751 | $15,023 |
| Standard Deviation (Population) | $17,548 | $14,824 |
Demographics Similar to Ukrainians and Romanians by Median Male Earnings
In terms of median male earnings, the demographic groups most similar to Ukrainians are Croatian ($59,715, a difference of 0.020%), Immigrants from Italy ($59,691, a difference of 0.060%), Immigrants from Hungary ($59,806, a difference of 0.13%), Immigrants from Ukraine ($59,820, a difference of 0.16%), and Afghan ($59,554, a difference of 0.29%). Similarly, the demographic groups most similar to Romanians are Immigrants from Bolivia ($60,088, a difference of 0.040%), Argentinean ($60,117, a difference of 0.090%), Paraguayan ($59,975, a difference of 0.15%), Immigrants from Egypt ($59,925, a difference of 0.23%), and Immigrants from North America ($60,265, a difference of 0.34%).
| Demographics | Rating | Rank | Median Male Earnings |
| Immigrants | Serbia | 99.7 /100 | #68 | Exceptional $60,600 |
| Immigrants | Canada | 99.7 /100 | #69 | Exceptional $60,388 |
| Immigrants | Bulgaria | 99.7 /100 | #70 | Exceptional $60,358 |
| Mongolians | 99.7 /100 | #71 | Exceptional $60,350 |
| Immigrants | Western Europe | 99.7 /100 | #72 | Exceptional $60,334 |
| Immigrants | North America | 99.7 /100 | #73 | Exceptional $60,265 |
| Argentineans | 99.6 /100 | #74 | Exceptional $60,117 |
| Immigrants | Bolivia | 99.6 /100 | #75 | Exceptional $60,088 |
| Romanians | 99.6 /100 | #76 | Exceptional $60,063 |
| Paraguayans | 99.5 /100 | #77 | Exceptional $59,975 |
| Immigrants | Egypt | 99.5 /100 | #78 | Exceptional $59,925 |
| Immigrants | Ukraine | 99.5 /100 | #79 | Exceptional $59,820 |
| Immigrants | Hungary | 99.5 /100 | #80 | Exceptional $59,806 |
| Ukrainians | 99.4 /100 | #81 | Exceptional $59,728 |
| Croatians | 99.4 /100 | #82 | Exceptional $59,715 |
| Immigrants | Italy | 99.4 /100 | #83 | Exceptional $59,691 |
| Afghans | 99.3 /100 | #84 | Exceptional $59,554 |
| Italians | 99.3 /100 | #85 | Exceptional $59,551 |
| Immigrants | England | 99.3 /100 | #86 | Exceptional $59,527 |
| Macedonians | 99.3 /100 | #87 | Exceptional $59,522 |
| Immigrants | Argentina | 99.3 /100 | #88 | Exceptional $59,491 |